. 2017 Nov 2;2(21):e96173.
doi: 10.1172/jci.insight.96173.

T cells presenting viral antigens or autoantigens induce cytotoxic T cell anergy

Affiliations

T cells presenting viral antigens or autoantigens induce cytotoxic T cell anergy

Nathalie E Blachère et al. JCI Insight. .

Abstract

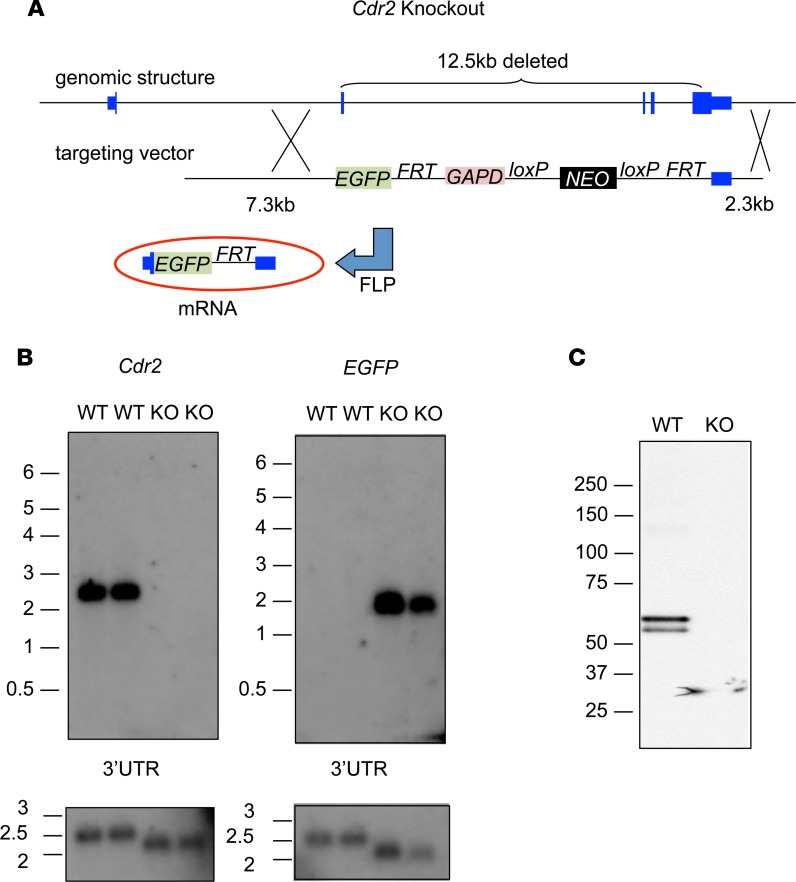
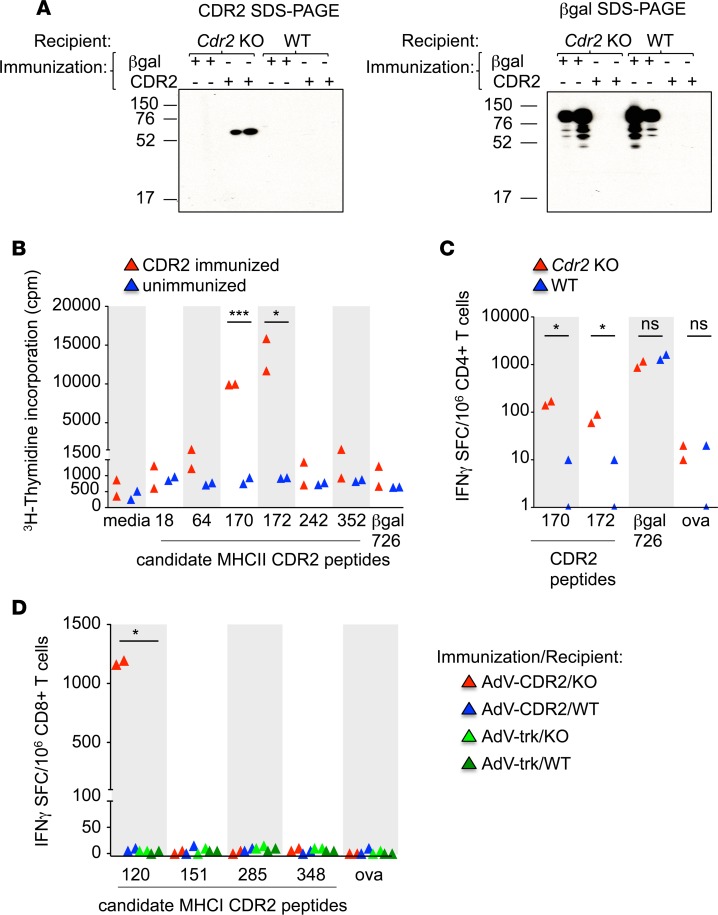
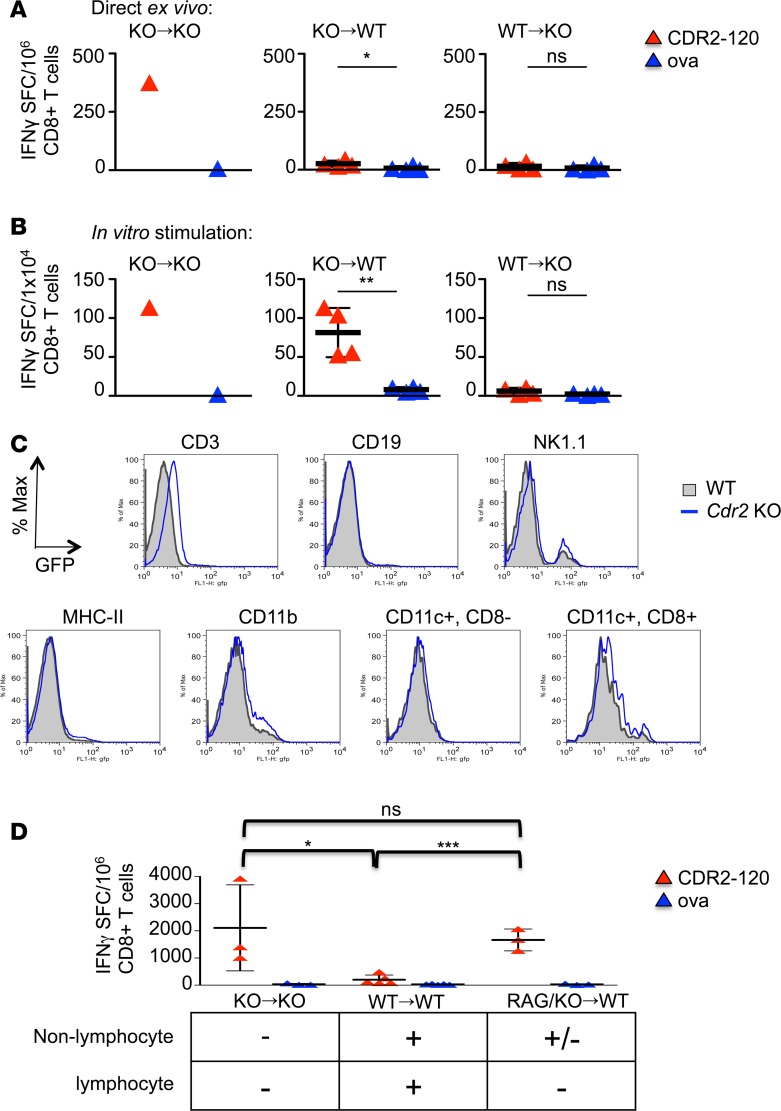
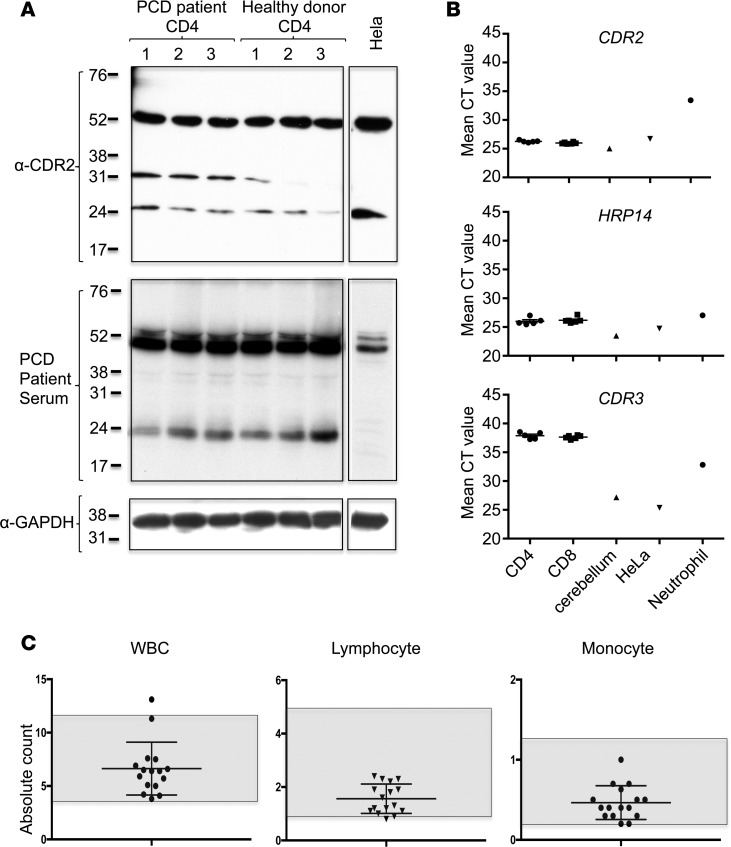
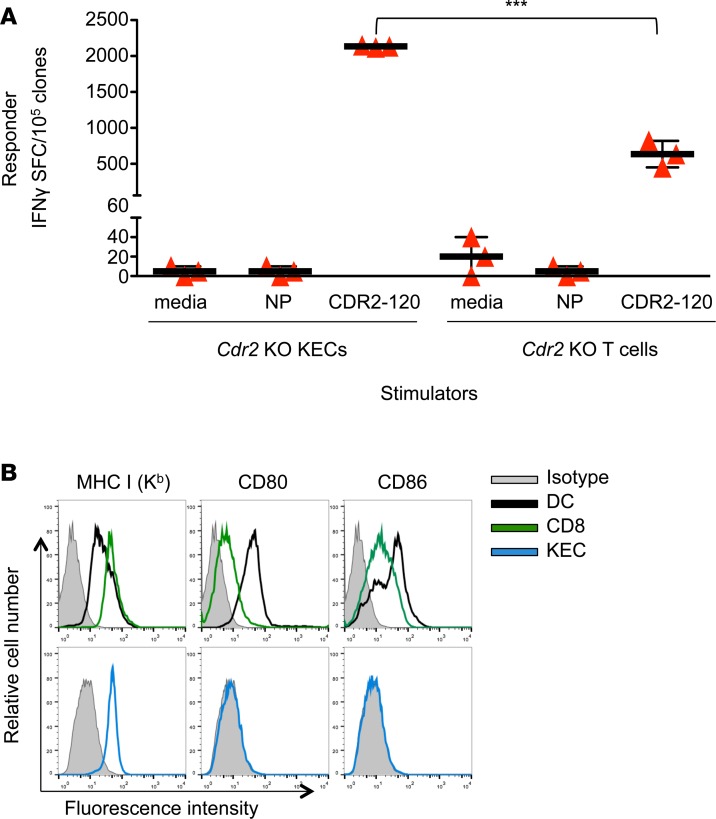
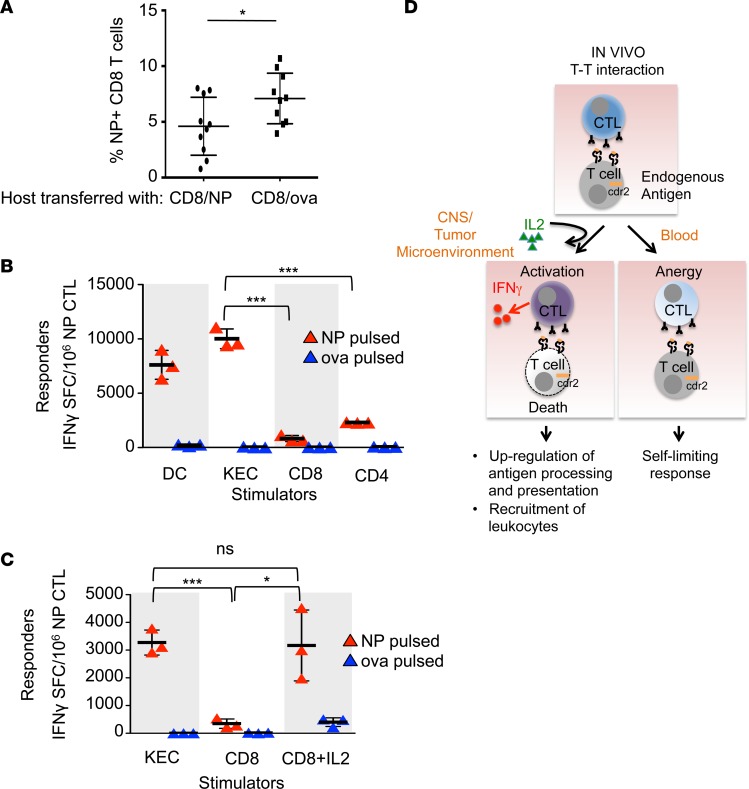
In the course of modeling the naturally occurring tumor immunity seen in patients with paraneoplastic cerebellar degeneration (PCD), we discovered an unexpectedly high threshold for breaking CD8+ cytotoxic T cell (CTL) tolerance to the PCD autoantigen, CDR2. While CDR2 expression was previously found to be strictly restricted to immune-privileged cells (cerebellum, testes, and tumors), unexpectedly we have found that T cells also express CDR2. This expression underlies inhibition of CTL activation; CTLs that respond to epithelial cells expressing CDR2 fail to respond to T cells expressing CDR2. This was a general phenomenon, as T cells presenting influenza (flu) antigen also fail to activate otherwise potent flu-specific CTLs either in vitro or in vivo. Moreover, transfer of flu peptide-pulsed T cells into flu-infected mice inhibits endogenous flu-specific CTLs. Our finding that T cells serve as a site of immune privilege, inhibiting effector CTL function, uncovers an autorepressive loop with general biologic and clinical relevance.


Conflict of interest statement

Conflict of interest: The authors have declared that no conflict of interest exists.

Figures

Figure 1
Figure 1. Construct and strategy for generating and validating Cdr2-KO mice.
(A) Schematic representation of the Cdr2 locus before and after homologous recombination with the targeting vector, as well as after FLP recombination. The elements in the final targeting vector in order (5′ to 3′) were: 7.3 kb of Cdr2 intron 1 and the first 14 bp of exon 2 (shown in blue); EGFP (shown in green); an FRT site; 1.5 kb from the human GAPD gene containing its 3′UTR and 1.3 kb of 3′ flanking sequence (shown in maroon); a neomycin resistance cassette (shown in black) flanked by loxP sites; a second FRT site; and 2.3 kb of the Cdr2 gene corresponding to the 0.9 kb Cdr2 3′UTR and 1.4 kb of 3′ flanking sequence. (B) Northern blot of 13th generation Cdr2-KO and WT mouse cerebellum. RNA was hybridized with probes for Cdr2, EGFP, and the 3′UTR of Cdr2. The blot was normalized by loading equal amounts of total RNA in each lane. (C) Western blot of Cdr2-KO and WT cerebellum. Cerebellar lysates were immunoprecipitated with a paraneoplastic cerebellar degeneration patient antibody and resolved by SDS-PAGE and probed with an anti-CDR2 antibody.
Figure 2
Figure 2. CDR2 expression in WT mice limits the generation of humoral and cellular immune responses to CDR2.
(A) Western blots of serum from Cdr2-KO or WT mice immunized with β-gal or CDR2 and tested for the presence of IgG 21 days later. Left panel: CDR2 resolved by SDS-PAGE. Right panel: β-Gal resolved by SDS-PAGE. One experiment is shown and is representative of 2 experiments. (B) CD4+ T cell proliferation as measured by 3H-thymidine incorporation from unimmunized or CDR2-immunized Cdr2-KO mice stimulated with candidate CDR2 peptide–pulsed Cdr2-KO splenocytes. Each triangle represents CD4+ T cells from 2 mice pooled and plated in triplicate wells and is representative of 3 experiments. (C) IFN-γ ELISPOT assay of CD4+ T cells from Cdr2-KO (n = 2) or WT hosts (n = 2) immunized with both AdV-β-gal and AdV-CDR2 and cultured with Cdr2-KO splenocytes pulsed with various peptides. Each triangle is the mean of triplicate wells of CD4+ T cells from 1 mouse and is representative of 3 experiments. (D) IFN-γ ELISPOT assay of CD8+ T cells from Cdr2-KO or WT hosts immunized with AdV-Trk or AdV-CDR2. Each triangle represents CD8+ T cells from 2 mice pooled and plated in triplicate wells and is representative of 3 experiments. *P < 0.05, ***P < 0.001; ns, statistically not significant as calculated using unpaired Student’s t test. AdV, adenovirus; Cpm, counts per minute; SFC, spot-forming cells; OVA, ovalbumin peptide.
Figure 3
Figure 3. T cell expression of CDR2 is sufficient to confer tolerance.
IFN-γ ELISPOTs of CD8+ T cells from bone marrow (BM) chimera mice 14 days after immunization with adenovirus expressing CDR2 (AdV-CDR2) and cultured with RMA-S cells pulsed with either OVA or CDR2-120 peptide immediately ex vivo (A) and after 7 days of splenocyte in vitro stimulation (B). Each triangle represents the mean of triplicate wells and the bar with error bars represents the mean and standard deviations of mice in that group. These data are representative of 2 experiments. KO→KO indicates Cdr2-KO BM donor cells transplanted into Cdr2-KO host mice (n = 1), KO→WT (n = 4) indicates Cdr2-KO BM donor cells transplanted into WT host mice, and WT→KO (n = 4) indicates WT BM donor cells transplanted into Cdr2-KO host mice. (C) Flow cytometry of hematopoietic cells from WT or Cdr2-KO mice. The EGFP gene replaces the Cdr2 gene in Cdr2-KO mice. Gray filled = WT, blue line = Cdr2-KO. One experiment is shown and is representative of 5 experiments. (D) BM chimeras were established as in A and B with the addition of RAG/Cdr2-KO→WT (n = 3) indicating a mix of 50:50 Rag1-KO and Cdr2-KO BM cells transplanted into WT mice. Fourteen days after immunization, splenocytes were stimulated in vitro for 7 days with CDR2-120 peptide and CD8+ T cells were tested for response to RMA-S cells pulsed with either OVA or CDR2-120 peptide by IFN-γ ELISPOT in triplicate wells. Results presented are 1 of 2 experiments. Each triangle represents the mean of triplicate wells and the bar with error bars represents the mean and standard deviations of mice in that group. These data are representative of 2 experiments. KO→KO (n = 3), WT→WT (n = 5), RAG/KO→WT (n = 3). *P < 0.05, **P < 0.01, ***P < 0.001; ns, statistically not significant as calculated using unpaired Student’s t test. SFC, spot-forming cells; OVA, ovalbumin peptide.
Figure 4
Figure 4. Human T cells express CDR2 protein.
(A) Western blot of CD4+ T cells from 3 paraneoplastic cerebellar degeneration (PCD) patients, 3 healthy donors, and HeLa cells probed with anti-CDR2 antibody (top panel). Membrane was stripped and reprobed first with PCD patient sera diluted 1:1,000 (middle panel) and then with anti-GAPDH antibody (lower panel). (B) qPCR of CDR3, CDR2, and HRP14 from healthy donor CD4+ T cells (n = 5), CD8+ T cells (n = 6), human cerebellum (n = 1), HeLa cells (n = 1), or neutrophils (n = 1). HRP14 RNA expression is presented as a housekeeping gene for the various cell and tissue types. Mean cycle time values of technical triplicates are presented. One experiment is shown and is representative of 3 experiments. (C) Absolute white blood cell, lymphocyte, and monocyte counts from 11 ovarian cancer patients with PCD drawn at the time of recent worsening of neurologic symptoms. All had high-titer (>1:1,000) antibodies against CDR2. Normal ranges are represented by the shaded area. Each bar represents the mean and error bars are standard deviations.
Figure 5
Figure 5. T cell presentation of CDR2 does not activate CDR2-specific T cell clones.
(A) IFN-γ ELISPOT assay of CDR2-specific T cell clones cultured with Cdr2-KO kidney epithelial cells (KECs) or T cells pulsed with various peptides. NP indicates pulsed with irrelevant control influenza peptide and CDR2-120 indicates pulsed with cognate peptide. Each bar represents the mean of triplicate wells and error bars are standard deviations. (B) Surface staining of MHCI and costimulatory molecules in DCs (black line), live T cells (green line), KECs (blue line), and isotype control (shaded). These data are representative of 3 experiments. ***P < 0.001, as calculated using unpaired Student’s t test. SFC, spot-forming cells.
Figure 6
Figure 6. T cell antigen presentation induces effector CTL split anergy.
(A) Flow cytometry of circulating CD45.2+ NP-specific tetramer+ CD8+ T cells in a flu-infected host transferred with either NP-pulsed (n = 10) or OVA-pulsed (n = 10) CD45.1+ CD8+ T cells. Each bar represents the mean and error bars are standard deviations. These data are representative of 2 experiments. (B) IFN-γ ELISPOT assay of NP-specific effector CTLs cultured with DCs or kidney epithelial cells (KECs) (stimulator to effector ratio of 1:30), or CD8+ or CD4+ T cells (stimulator to effector ratio of 1:1). Each bar represents the mean of triplicate wells and error bars are standard deviations. These data are representative of 2 experiments. (C) IFN-γ ELISPOT assay of NP-specific effector CTLs cultured with KECs (stimulator to effector ratio of 1:30), CD8+ T cells (stimulator to effector ratio of 1:1), or CD8+ T cells plus IL-2. Stimulator cells were pulsed with either NP or OVA peptide. Each bar represents the mean of triplicate wells and error bars are standard deviations. These data are representative of 2 experiments. *P < 0.05, ***P < 0.001; ns, statistically not significant as calculated using unpaired Student’s t test. (D) Proposed model of the plasticity of CTL responses to antigen encounters and how the data presented in this paper may relate to human diseases. In the steady state (peripheral blood), armed effector CTLs respond to other T cells presenting cognate antigen by killing the stimulator T cell, but do not secrete IFN-γ. The effector CTL itself survives and is anergic. In the context of an inflammatory microenvironment (tumor or other inflamed tissue), exogenous IL-2 licenses the effector CTL to become fully activated and it secretes IFN-γ in addition to killing targets. IFN-γ augments immune responses upregulating antigen processing and presentation as well as promoting the recruitment of leukocytes to the tissue, promoting tumor immunity and autoimmunity seen in paraneoplastic neurologic disease. SFC, spot-forming cells.

References

    1. Albert ML, Austin LM, Darnell RB. Detection and treatment of activated T cells in the cerebrospinal fluid of patients with paraneoplastic cerebellar degeneration. Ann Neurol. 2000;47(1):9–17. doi: 10.1002/1531-8249(200001)47:1<9::AID-ANA5>3.0.CO;2-I. - DOI - PubMed
    1. Albert ML, Darnell JC, Bender A, Francisco LM, Bhardwaj N, Darnell RB. Tumor-specific killer cells in paraneoplastic cerebellar degeneration. Nat Med. 1998;4(11):1321–1324. doi: 10.1038/3315. - DOI - PubMed
    1. Darnell RB. Paraneoplastic neurologic disorders: windows into neuronal function and tumor immunity. Arch Neurol. 2004;61(1):30–32. doi: 10.1001/archneur.61.1.30. - DOI - PubMed
    1. Santomasso BD, et al. A T-cell receptor associated with naturally occurring human tumor immunity. Proc Natl Acad Sci USA. 2007;104(48):19073–19078. doi: 10.1073/pnas.0704336104. - DOI - PMC - PubMed
    1. Darnell RB, Posner JB. Paraneoplastic syndromes involving the nervous system. N Engl J Med. 2003;349(16):1543–1554. doi: 10.1056/NEJMra023009. - DOI - PubMed

Publication types

MeSH terms