. 2017 Nov 2;2(21):e93764.
doi: 10.1172/jci.insight.93764.

NOTCH3 regulates stem-to-mural cell differentiation in infantile hemangioma

Affiliations

NOTCH3 regulates stem-to-mural cell differentiation in infantile hemangioma

Andrew K Edwards et al. JCI Insight. .

Abstract

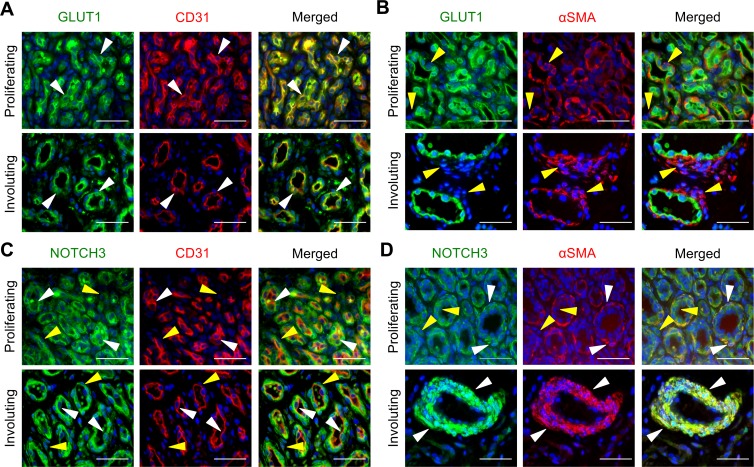
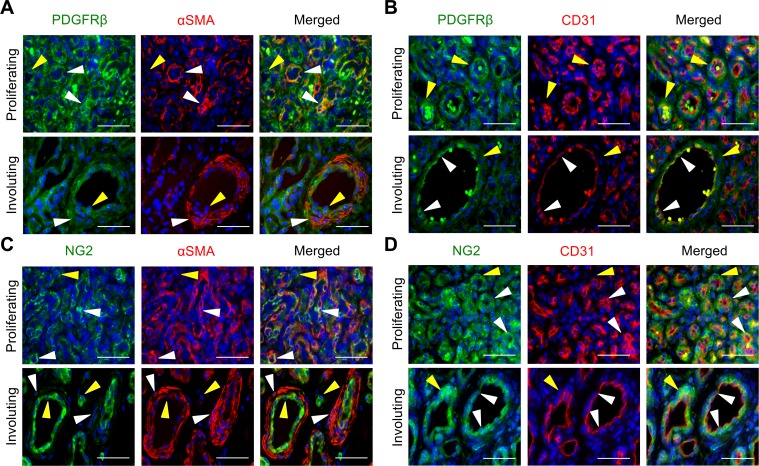
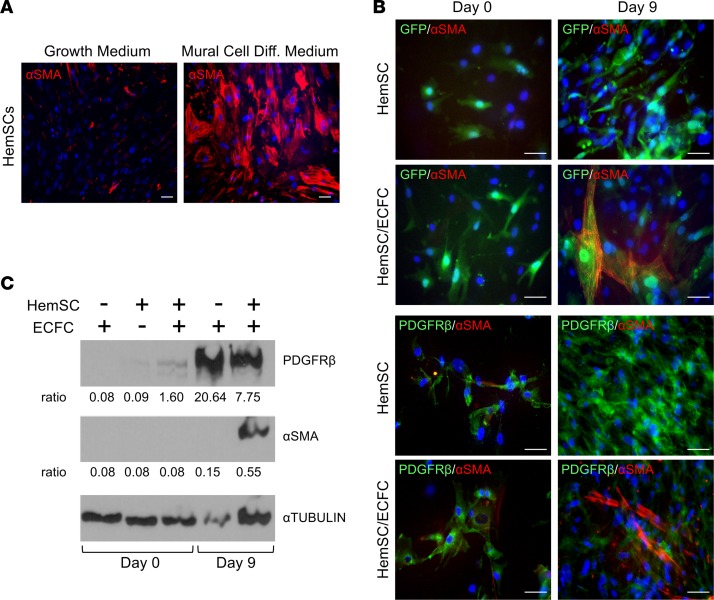
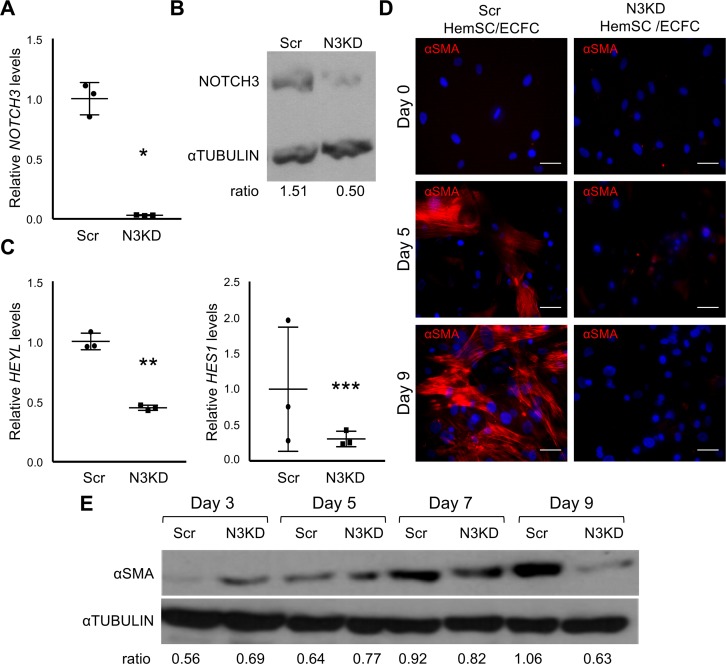
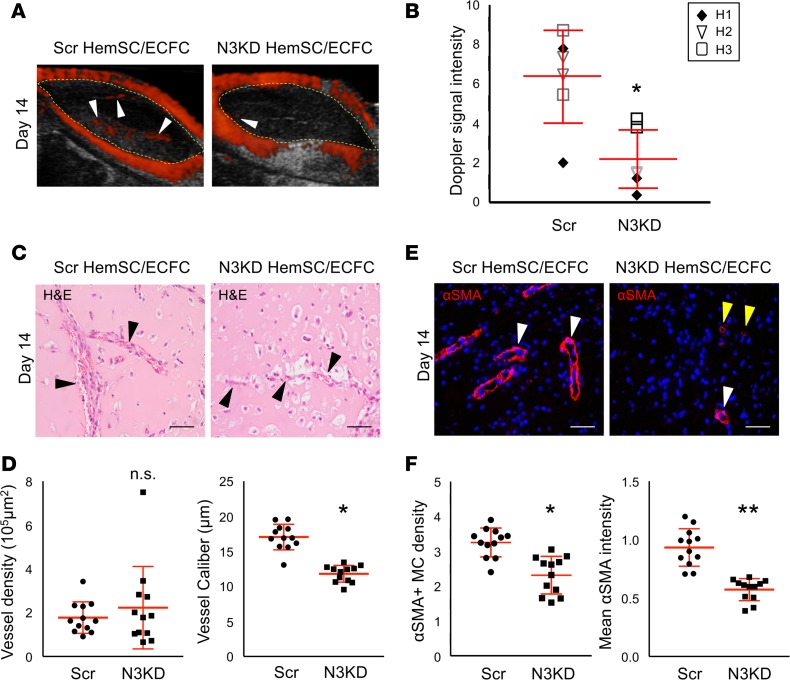
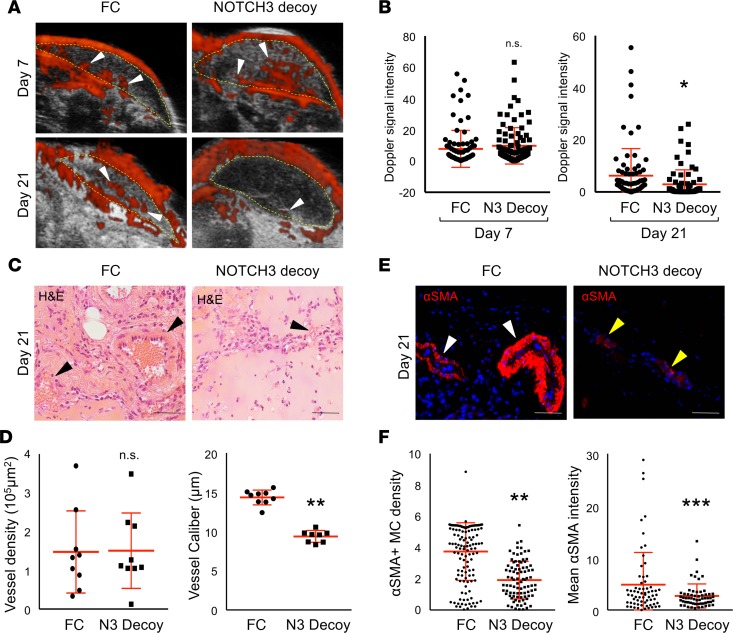
Infantile hemangioma (IH) is a vascular tumor that begins with rapid vascular proliferation shortly after birth, followed by vascular involution in early childhood. We have found that NOTCH3, a critical regulator of mural cell differentiation and maturation, is expressed in hemangioma stem cells (HemSCs), suggesting that NOTCH3 may function in HemSC-to-mural cell differentiation and pathological vessel stabilization. Here, we demonstrate that NOTCH3 is expressed in NG2+PDGFRβ+ perivascular HemSCs and CD31+GLUT1+ hemangioma endothelial cells (HemECs) in proliferating IHs and becomes mostly restricted to the αSMA+NG2loPDGFRβlo mural cells in involuting IHs. NOTCH3 knockdown in HemSCs inhibited in vitro mural cell differentiation and perturbed αSMA expression. In a mouse model of IH, NOTCH3 knockdown or systemic expression of the NOTCH3 inhibitor, NOTCH3 Decoy, significantly decreased IH blood flow, vessel caliber, and αSMA+ perivascular cell coverage. Thus, NOTCH3 is necessary for HemSC-to-mural cell differentiation, and adequate perivascular cell coverage of IH vessels is required for IH vessel stability.


Conflict of interest statement

Conflict of interest: TK, JKK, and CJS report that Columbia University and the authors have patents covering the work described herein: “Human NOTCH1 Decoys” (WO2013052607; TK, CJS, JK), “Composition of humanized NOTCH fusion proteins and methods of treatment” (US Patent 20110008342 A1; CJS, JK), and “Notch-based Fusion Proteins and Uses Thereof” (US Patent 7662919 B2; CJS, JK).

Figures

Figure 1
Figure 1. NOTCH3 is expressed in perivascular and lumenal cells in IHs.
Serial sections of proliferating and involuting infantile hemangioma (IH) specimens were stained. (A) GLUT1 and CD31 costaining. White arrowheads mark GLUT1+CD31+ cells. Proliferating IH n = 2, involuting IH n = 3. (B) GLUT1 and αSMA costaining. Yellow arrowheads mark αSMA+GLUT1 perivascular cells. Proliferating IH n = 2, involuting IH n = 7. (C) NOTCH3 and CD31 costaining. White arrowheads mark NOTCH3+CD31+ cells. Yellow arrowheads mark NOTCH3+CD31 cells. Proliferating IH n = 4, involuting IH n = 5. (D) NOTCH3 and αSMA costaining. White arrowheads mark NOTCH3+αSMA+ perivascular cells. Yellow arrowheads mark NOTCH3+αSMA lumenal cells. Proliferating IH n = 5, involuting IH n = 8. Scale bars: 50 μm. The total number of IH specimens assessed for each antigen is presented in Supplemental Table 3. αSMA, α smooth muscle actin; GLUT1, glucose transporter 1.
Figure 2
Figure 2. Perivascular PDGFRβ and NG2 expression is decreased and misexpressed in lumenal endothelial cells during IHs progression.
Serial sections of proliferating and involuting infantile hemangioma (IH) specimens were stained. (A) PDGFRβ and αSMA costaining. White arrowheads mark PDGFRβ+αSMA+ perivascular cells. Yellow arrowheads mark PDGFRβ+αSMA lumenal cells. Proliferating IH n = 2, involuting IH n = 3. (B) PDGFRβ and CD31 costaining. White arrowheads mark PDGFRβ+CD31+ lumenal endothelial cells. Yellow arrowheads mark PDGFRβ+CD31 perivascular cells. Proliferating IH n = 3, involuting IH n = 2. (C) NG2 and αSMA costaining. White arrowheads mark NG2+αSMA+ cells, and yellow arrowheads mark NG2+αSMA cells. Proliferating IH n = 7, involuting IH n = 7. (D) NG2 and CD31 costaining. White arrowheads mark NG2+CD31+ cells, and yellow arrowheads mark NG2+CD31 cells. Proliferating IH n = 7, involuting IH n = 3. Scale bars: 50 μm. The total number of IH specimens assessed for each antigen is presented in Supplemental Table 3. αSMA, α smooth muscle actin; NG2, neuron-glial antigen 2.
Figure 3
Figure 3. HemSCs differentiate into αSMA+PDGFRβlo mural cells in culture.
(A) HemSCs (n = 3) were grown either in growth or mural cell differentiation media for 2 weeks and stained for αSMA. (B) GFP+ HemSCs (n = 3) alone or cocultured with ECFCs in growth media were stained for αSMA or PDGFRβ at day 0 and 9. (C) Day 0 and 9 lysates from HemSC and HemSC/ECFC cocultures (n = 3) were subjected to Western analysis, and probed with antibodies against PDGFRβ, αSMA, or α-TUBULIN as a loading control. Representative data from 3 independent HemSC populations done a total of 10 times are presented. The ratio of PDGFRβ and αSMA band intensity normalized by α-TUBULIN band intensity is presented below each image. Scale bars: 50 μm. αSMA, α smooth muscle actin; ECFC, endothelial colony-forming cell; Diff, differentiation, HemSC, hemangioma stem cell.
Figure 4
Figure 4. NOTCH3 is necessary for HemSC mural cell differentiation.
(AC) Assessment of NOTCH3 knockdown (N3KD) in HemSCs. (A) Relative NOTCH3 transcript levels in control HemSCs (Scr), and N3KD HemSCs determined by qRT-PCR and normalized by BACTIN. Representative data from 4 independent N3KD HemSC populations and matching Scr HemSC populations are presented. Error bars represent ± SD. *P < 0.007, Student’s t test. (B) Representative data of Western analysis from 2 independent N3KD and matching Scr HemSC lysates probed with antibodies against NOTCH3 or α-tubulin as a loading control. (C) Relative HEYL and HES1 transcript levels in Scr and N3KD HemSCs determined by qRT-PCR and normalized by BACTIN expression. Representative data presented from 3 independent HemSC populations done in duplicate. Error bars represent ± SD. **P < 0.0007, ***P < 0.05, Student’s t test. (D) Scr HemSCs (n = 3) or N3KD HemSCs (n = 3) cocultured with ECFCs in growth media were stained for αSMA at days 0, 5, and 9. Scale bars: 50 μm. (E) Day 3, 5, 7, and 9 lysates from Scr and N3KD HemSC/ECFC cocultures were subjected to Western analysis, and probed with antibodies against αSMA or α-tubulin as a loading control. Ratio of αSMA band intensity normalized by α-tubulin band intensity presented below. Representative data from 3 Scr and N3KD HemSC populations and experiments perform in duplicate for each HemSC population. αSMA, α smooth muscle actin; ECFC, endothelial colony-forming cell; HemSC, hemangioma stem cell; Scr, scrambled.
Figure 5
Figure 5. NOTCH3 activity is required for HemSC mural cell differentiation and IH development in a mouse model of IH.
NOTCH3-knockdown (N3KD) HemSCs or Scr HemSCs in a 1:1 ratio with ECFCs were resuspended in Matrigel, and subcutaneously implanted into the flanks of immunocompromised mice. (A) Detection of high blood flow by ultrasound Doppler in Scr HemSC/ECFC and N3KD HemSC/ECFC xenografts at day 14 after implantation. Xenograft area marked with yellow dotted line. White arrowheads mark Dopplerable blood flow (red). (B) Scatter plot of mean Doppler signal intensity normalized by xenograft area (n = 3 populations: H1, H2, H3; n = 2 implants each). Average mean intensity denoted with a horizontal line. Error bars represent ± SD. *P < 0.03, 1-way ANOVA. (C) H&E staining of Scr HemSC/ECFC and N3KD HemSC/ECFC xenograft sections. Arrowheads mark red blood cell–containing vessels. (D) Quantification of vessel density and caliber (n = 3 populations; n = 2 implants each). Error bars represent ± SD. *P < 0.0002, 1-way ANOVA. (E) Scr HemSC/ECFC and N3KD HemSC/ECFC xenograft sections stained for αSMA. White arrowheads mark vessel surrounded by αSMA+ mural cells. Yellow arrowheads mark vessel surrounded by mural cells that express low levels of αSMA. (F) αSMA+ mural cell density determined as mean mural cell αSMA signal intensity normalized to IH endothelial GLUT1 signal intensity. Average mural cell αSMA expression determined as mean αSMA signal intensity–normalized DAPI+αSMA+ cell number (n = 3 populations; n = 2 implants each). Error bars represent ± SD. n.s., not significant. *P < 0.0002, **P < 0.000005, 1-way ANOVA. Scale bars: 50 μm. αSMA, α smooth muscle actin; ECFC, endothelial colony-forming cell; GLUT1, glucose transporter 1; HemSC, hemangioma stem cell; IH, infantile hemangioma, MC, mural cell; Scr, scrambled.
Figure 6
Figure 6. A NOTCH3 inhibitor, NOTCH3 Decoy, blocks IH development and mural cell differentiation.
HemSCs and ECFCs in a 1:1 ratio were resuspended in Matrigel and implanted subcutaneously into immunocompromised mice. An adenovirus encoding NOTCH3 Decoy (N3 Decoy) or FC (control) was administered at either day 3 (H43, data not shown) or day 7 (H49) after implantation and IH development assessed until day 21 (schematic in Supplemental Figure 10A). (A) Detection of high blood flow by ultrasound Doppler of HemSC/ECFC xenografts prior to (day 7) and after (day 21) N3 Decoy and FC adenovirus injection. Xenograft area marked with yellow dotted line. White arrowheads mark Dopplerable blood flow (red). (B) Quantification of Doppler signal intensity normalized to implant area on day 7 and 21 (n = 2 populations; n = 4 implants each). *P < 0.05, Student’s t test. (C) H&E staining of N3 Decoy– and FC-treated xenograft sections. Arrowheads mark red blood cell–containing vessels. (D) Quantification of vessel density and caliber (n = 2 populations; n = 4 implants each). **P < 0.0005, Student’s t test. (E) N3 Decoy and FC HemSC/ECFC xenograft sections stained for αSMA. White arrowheads mark vessel surrounded by αSMA+ mural cells. Yellow arrowheads mark vessel surrounded by mural cells that express low levels of αSMA. (F) αSMA+ mural cell density determined as mean mural cell αSMA signal intensity normalized to IH endothelial GLUT1 signal intensity. Average mural cell αSMA expression determined as mean αSMA signal intensity–normalized DAPI+αSMA+ cell number (n = 2 populations; n = 4 implants each). n.s., not significant. **P < 0.0005, ***P < 0.01, Student’s t test. Scale bars: 50 μm. αSMA, α smooth muscle actin; ECFC, endothelial colony-forming cell; GLUT1, glucose transporter 1; HemSC, hemangioma stem cell; IH, infantile hemangioma, MC, mural cell; N3 Decoy; NOTCH3 Decoy; Scr, scrambled.

References

    1. Mulliken JB, Fishman SJ, Burrows PE. Vascular anomalies. Curr Probl Surg. 2000;37(8):517–584. doi: 10.1016/S0011-3840(00)80013-1. - DOI - PubMed
    1. Léauté-Labrèze C, Harper JI, Hoeger PH. Infantile haemangioma. Lancet. 2017;390(10089):85–94. doi: 10.1016/S0140-6736(16)00645-0. - DOI - PubMed
    1. Khan ZA, et al. Multipotential stem cells recapitulate human infantile hemangioma in immunodeficient mice. J Clin Invest. 2008;118(7):2592–2599. doi: 10.1172/JCI33493. - DOI - PMC - PubMed
    1. North PE, Waner M, Mizeracki A, Mihm MC. GLUT1: a newly discovered immunohistochemical marker for juvenile hemangiomas. Hum Pathol. 2000;31(1):11–22. doi: 10.1016/S0046-8177(00)80192-6. - DOI - PubMed
    1. Haggstrom AN, et al. Prospective study of infantile hemangiomas: clinical characteristics predicting complications and treatment. Pediatrics. 2006;118(3):882–887. doi: 10.1542/peds.2006-0413. - DOI - PubMed

MeSH terms