. 2017 Nov 1;8(1):1231.
doi: 10.1038/s41467-017-01174-3.

Combating subclonal evolution of resistant cancer phenotypes

Affiliations

Combating subclonal evolution of resistant cancer phenotypes

Samuel W Brady et al. Nat Commun. .

Erratum in

  • Publisher Correction: Combating subclonal evolution of resistant cancer phenotypes.
    Brady SW, McQuerry JA, Qiao Y, Piccolo SR, Shrestha G, Jenkins DF, Layer RM, Pedersen BS, Miller RH, Esch A, Selitsky SR, Parker JS, Anderson LA, Dalley BK, Factor RE, Reddy CB, Boltax JP, Li DY, Moos PJ, Gray JW, Heiser LM, Buys SS, Cohen AL, Johnson WE, Quinlan AR, Marth G, Werner TL, Bild AH. Brady SW, et al. Nat Commun. 2018 Feb 5;9(1):572. doi: 10.1038/s41467-017-02383-6. Nat Commun. 2018. PMID: 29402882 Free PMC article.

Abstract

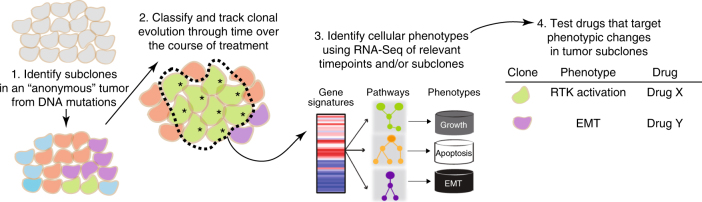
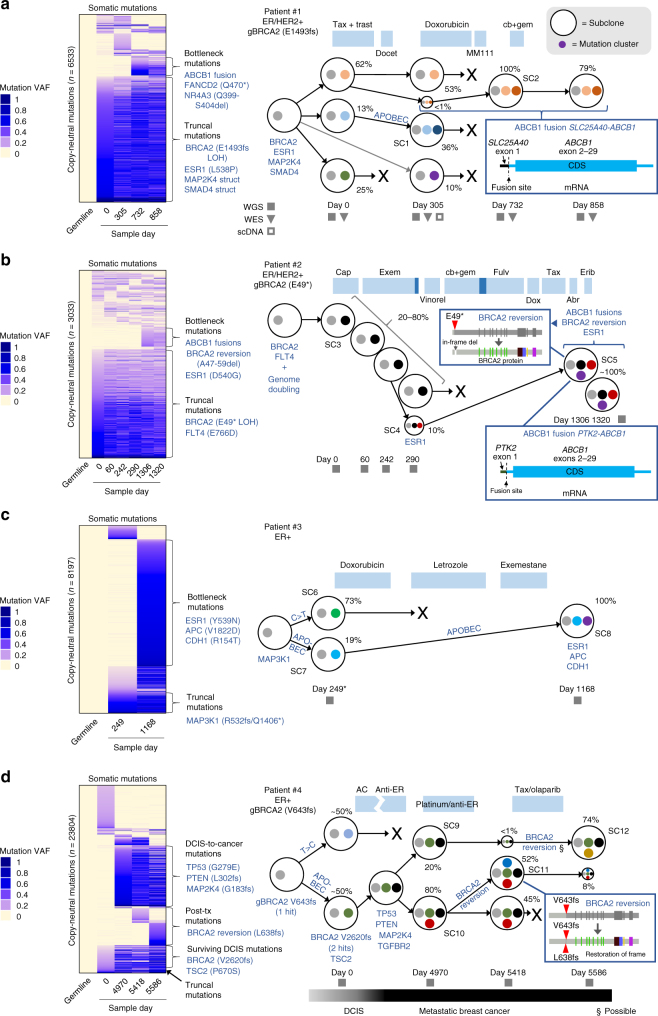
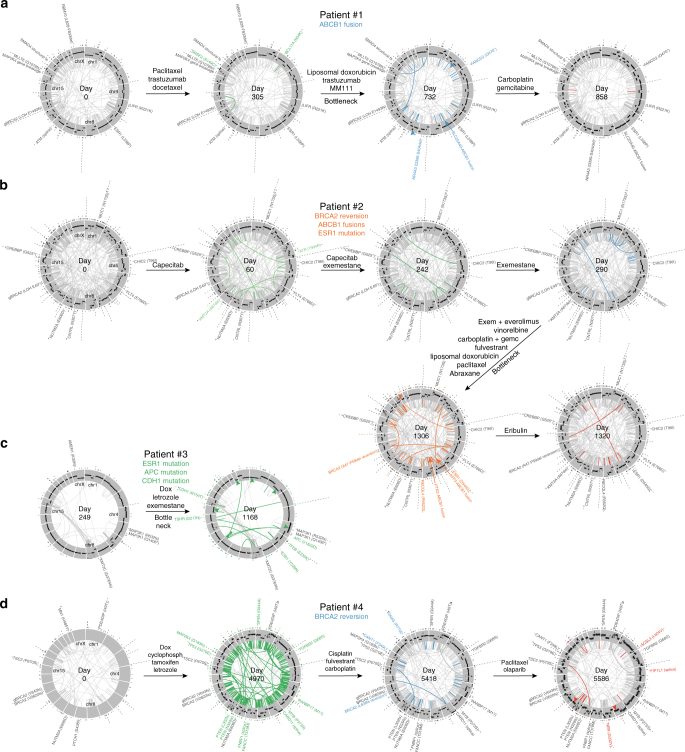
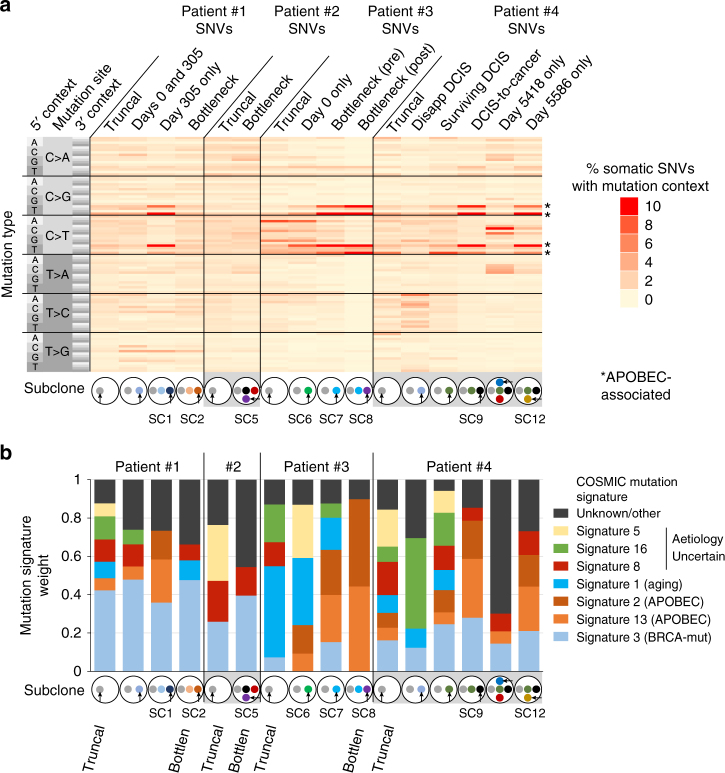
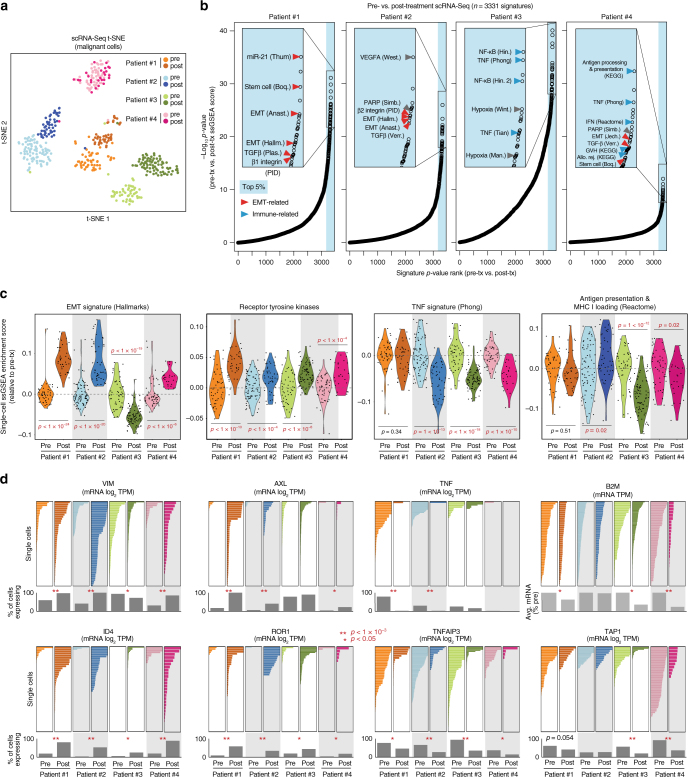
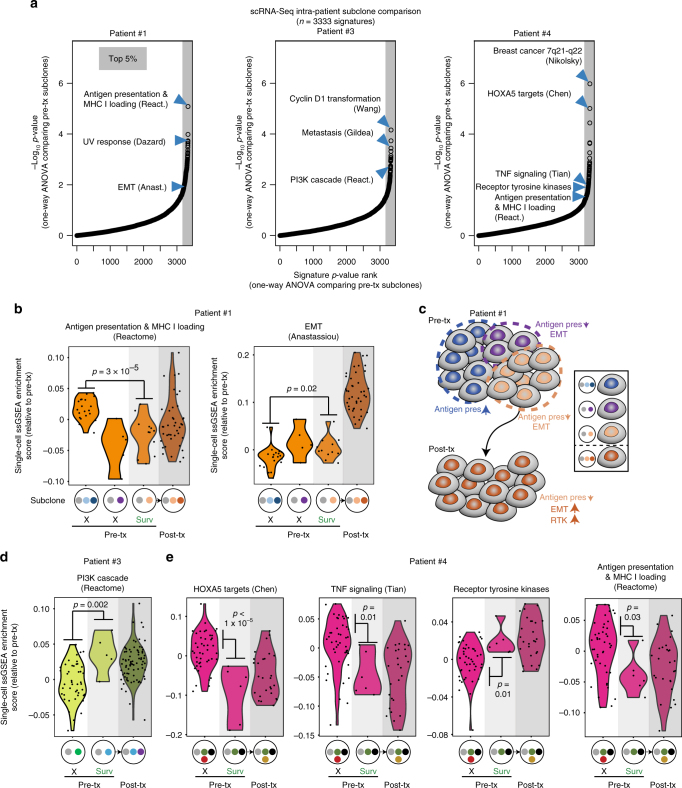
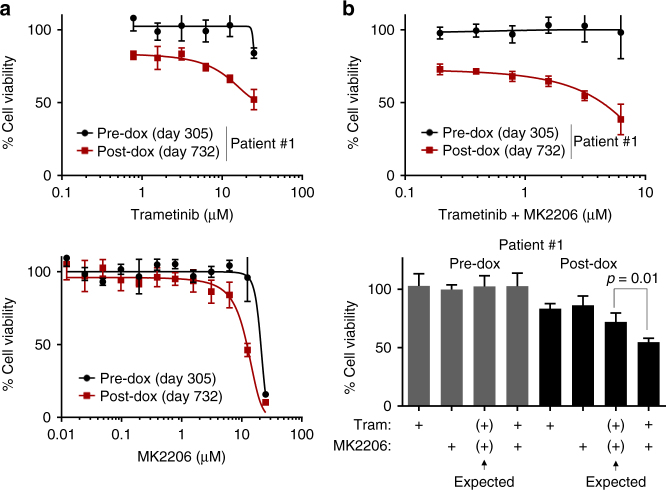
Metastatic breast cancer remains challenging to treat, and most patients ultimately progress on therapy. This acquired drug resistance is largely due to drug-refractory sub-populations (subclones) within heterogeneous tumors. Here, we track the genetic and phenotypic subclonal evolution of four breast cancers through years of treatment to better understand how breast cancers become drug-resistant. Recurrently appearing post-chemotherapy mutations are rare. However, bulk and single-cell RNA sequencing reveal acquisition of malignant phenotypes after treatment, including enhanced mesenchymal and growth factor signaling, which may promote drug resistance, and decreased antigen presentation and TNF-α signaling, which may enable immune system avoidance. Some of these phenotypes pre-exist in pre-treatment subclones that become dominant after chemotherapy, indicating selection for resistance phenotypes. Post-chemotherapy cancer cells are effectively treated with drugs targeting acquired phenotypes. These findings highlight cancer's ability to evolve phenotypically and suggest a phenotype-targeted treatment strategy that adapts to cancer as it evolves.


Conflict of interest statement

The authors declare no competing financial interests.

Figures

Fig. 1
Fig. 1
Overview of systems approach for identifying therapeutic vulnerabilities from longitudinal genomic analysis. *resistant subclone
Fig. 2
Fig. 2
Subclonal evolution of four breast cancers over 2–15 years. ad Subclonal evolution of breast cancer patients #1 to #4 through treatment. Left side shows variant allele frequencies of copy-neutral somatic SNVs and indels (WGS) organized into clusters, with relevant cancer-associated mutations (may or may not be copy-neutral and includes structural variants) indicated. Right shows subclone evolution. Subclones are indicated by large circles; mutation clusters are indicated by small colored circles. Relevant mutations in subclones are indicated by text or boxed insets. CCF is indicated as percent next to subclone. Filled squares indicate timepoints sequenced by whole-genome sequencing (WGS), filled inverted triangles indicate whole-exome sequencing (WES), and empty squares indicate targeted single-cell DNA sequencing (scDNA). Abr, Abraxane; cap, capecitabine; cb, carboplatin; dox, doxorubicin; erib, eribulin; exem, exemestane; fulv, fulvestrant; gem, gemcitabine; Tax, paclitaxel; trast, trastuzumab; vinorel, vinorelbine. *Patient #3 day 0 had RNA-Seq only. gBRCA2 indicates a germline BRCA2 mutation
Fig. 3
Fig. 3
SNV, structural variant, and CNA evolution in four breast cancers. ad Circos plots showing mutation evolution of breast cancer patients #1 to #4 through treatment. Each circle represents chromosomes 1 through X (clockwise from top) arranged in a circle. Protein-coding somatic SNVs and indels are indicated outside each circle as ticks or, for Cancer Gene Census genes, by name. Germline BRCA2 mutations are indicated as “gBRCA2.” Structural variants (large deletions, translocations, inversions, and duplications) are indicated inside each circle as a line joining the start and end of the variant, with Cancer Gene Census gene mutations indicated outside. Copy number changes are represented in the gray region with higher copy towards the outer edge. Newly appearing SNVs, indels, and structural variants are shown in color, while selected newly appearing CNAs are indicated by colored arrows. CNAs were not determined in the patient #4 day 0 sample due to technical issues with FFPE samples
Fig. 4
Fig. 4
Mutation signature evolution in four breast cancers. a Heatmap showing percent of SNVs in indicated subclones, defined in Fig. 2, with each of 96 possible mutation/trinucleotide context combinations. b Mutation signature weights for COSMIC mutation signatures in indicated subclones. Signatures with <0.03 average weight and mutations not accounted for by known signatures are included in the unknown/other group
Fig. 5
Fig. 5
Single-cell RNA-Seq of pre- and post-treatment breast cancers reveals increased immune-avoidance, EMT, and RTK phenotypes. a t-SNE analysis of 428 individual cells’ expression profiles from pre- and post-treatment breast cancer samples from four patients. b Plots of P-values (t-test-derived) comparing ssGSEA enrichment scores for 3331 C2 signatures between pre- and post-treatment single cells in each patient. x-axis, P-value ranks (higher ranks are more significant); y-axis, −log10(P-value). Red arrows, EMT- and stem cell-related signatures; blue arrows, immune-related signatures. c ssGSEA enrichment score (relative to pre-treatment average) violin plots for single cells in each sample for indicated signatures. Each point represents a single cell. P-values are by Student’s t-test (two-tailed). d Expression of indicated genes by scRNA-Seq (x-axis) in individual cells (y-axis) with percent of cells expressing each gene or average expression indicated below in gray bars. P-values are by two-sample proportion test. *P < 0.05. **P < 1 × 10−3. x-axis scales all begin at zero (left) and are the same within patients for each gene
Fig. 6
Fig. 6
Pre-existence of post-treatment phenotypes in pre-treatment survivor subclones. a Plots of P-values (one-way ANOVA) comparing scRNA-Seq ssGSEA enrichment scores for 3331 C2 signatures, plus the receptor tyrosine kinases (all-58) signature and our anti-apoptosis signature, between subclones in each indicated patient’s pre-treatment sample. x-axis, P-value ranks (higher ranks are more significant); y-axis, −log10(P-value). b Patient #1 ssGSEA enrichment scores for single cells in each pre-treatment subclone, with post-treatment cells shown for comparison and the dominant post-treatment subclone indicated. Each dot represents a single cell. P-values are by Student’s t-test. Subclones correspond to those shown in Fig. 2a. “X” indicates disappearing subclone while “Surv” indicates the subclone giving rise to the post-treatment sample. c Schematic showing subclonal phenotypic heterogeneity and evolution in pre-treatment patient #1 cells. d As in b but for patient #3. Subclones correspond to those in Fig. 2c. e as in b but for patient #4, with subclones as shown in Fig. 2d
Fig. 7
Fig. 7
Acquired sensitivity to drugs targeting post-chemotherapy phenotypes. a Drug response assay comparing pre- and post-doxorubicin patient #1 cancer cells’ sensitivity to drugs after 3-day treatment (fibroblast feeder system; CellTiter-Glo was used). b Indicated cells were treated with equimolar doses of trametinib and MK2206 for 3 days, followed by CellTiter-Glo (top); synergy analysis of 3.125 µM doses of these drugs (bottom). Expected is by Bliss independence; P-value is by Student’s t-test (two-tailed). Fibroblast feeder system was used and fibroblast signal was subtracted out in a, b and percentages are relative to DMSO control mean. Error bars show s.d. of four technical replicates

References

    1. Gerlinger M, et al. Intratumor heterogeneity and branched evolution revealed by multiregion sequencing. N. Engl. J. Med. 2012;366:883–892. doi: 10.1056/NEJMoa1113205. - DOI - PMC - PubMed
    1. Fisher R, Pusztai L, Swanton C. Cancer heterogeneity: implications for targeted therapeutics. Br. J. Cancer. 2013;108:479–485. doi: 10.1038/bjc.2012.581. - DOI - PMC - PubMed
    1. Vogelstein B, et al. Cancer genome landscapes. Science. 2013;339:1546–1558. doi: 10.1126/science.1235122. - DOI - PMC - PubMed
    1. Cancer Genome Atlas Network Comprehensive molecular portraits of human breast tumours. Nature. 2012;490:61–70. doi: 10.1038/nature11412. - DOI - PMC - PubMed
    1. Sequist LV, et al. Genotypic and histological evolution of lung cancers acquiring resistance to EGFR inhibitors. Sci. Transl. Med. 2011;3:75ra26. doi: 10.1126/scitranslmed.3002003. - DOI - PMC - PubMed

Publication types