. 2017 Nov 1;8(1):1252.
doi: 10.1038/s41467-017-01254-4.

Developmental increases in white matter network controllability support a growing diversity of brain dynamics

Affiliations

Developmental increases in white matter network controllability support a growing diversity of brain dynamics

Evelyn Tang et al. Nat Commun. .

Abstract

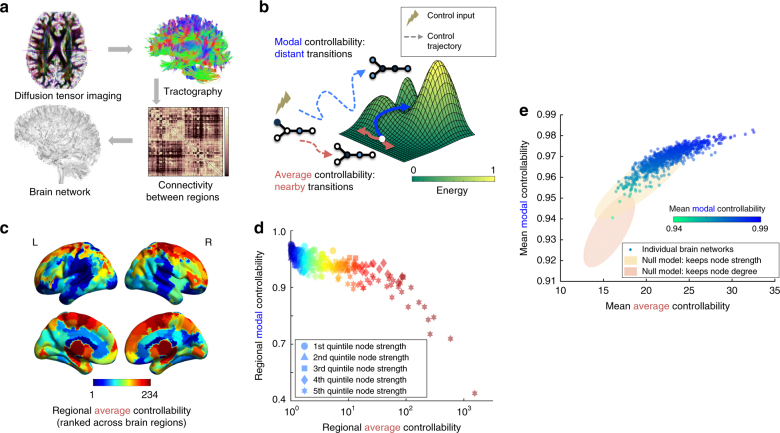
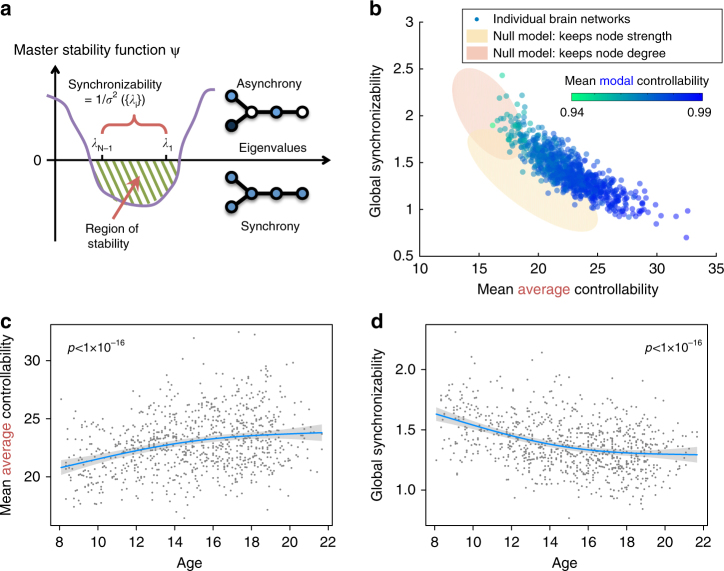
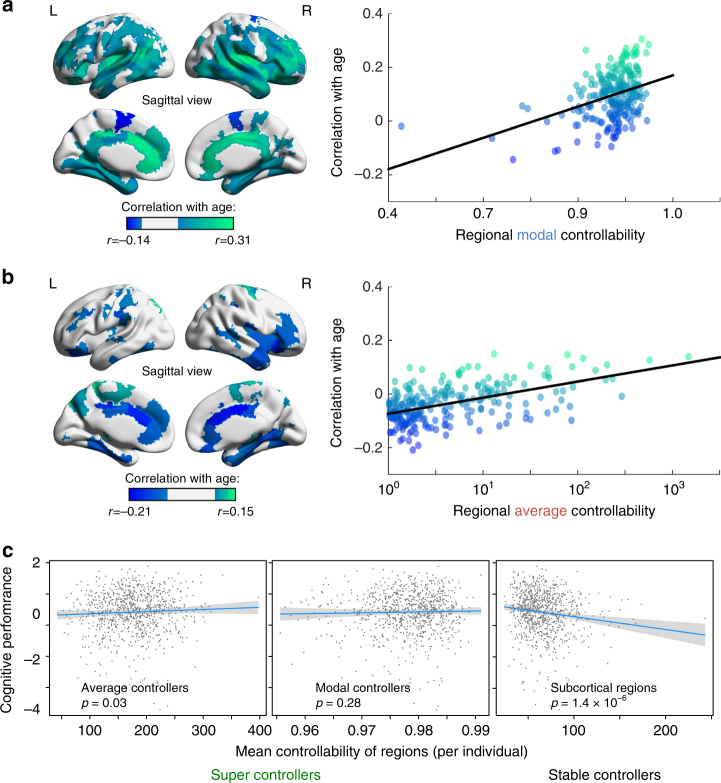
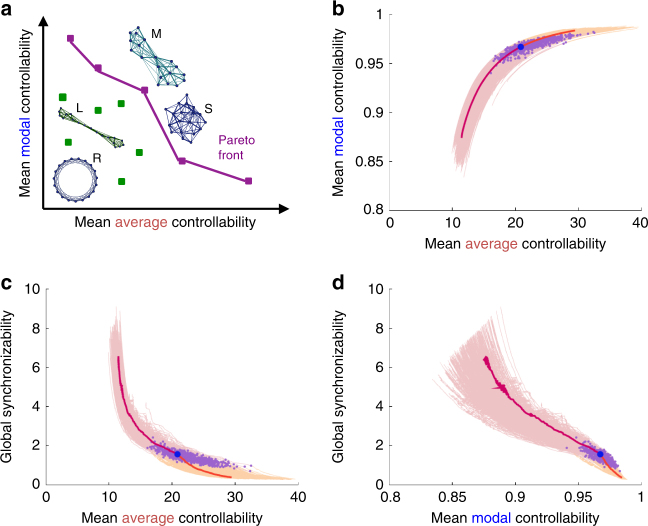
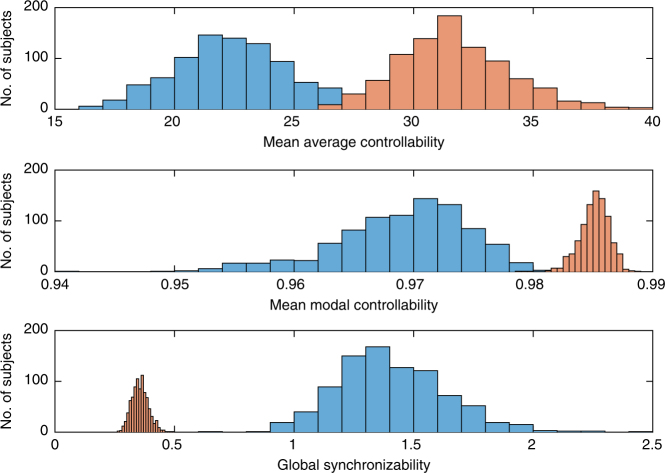
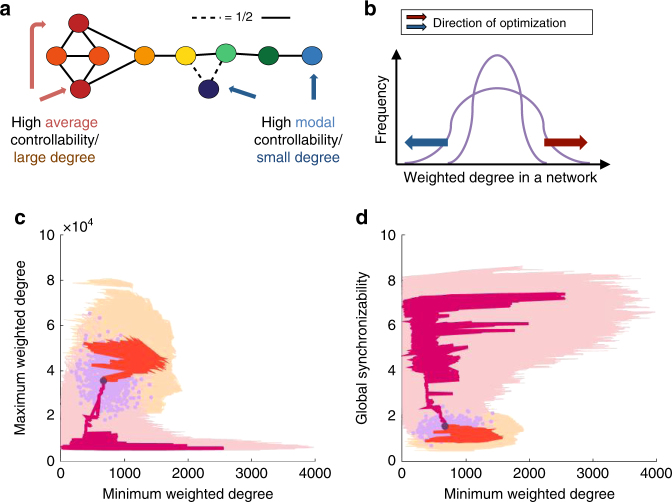
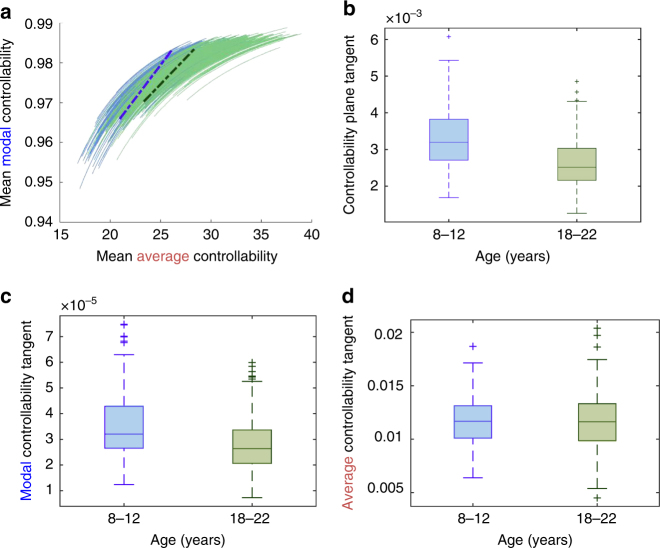
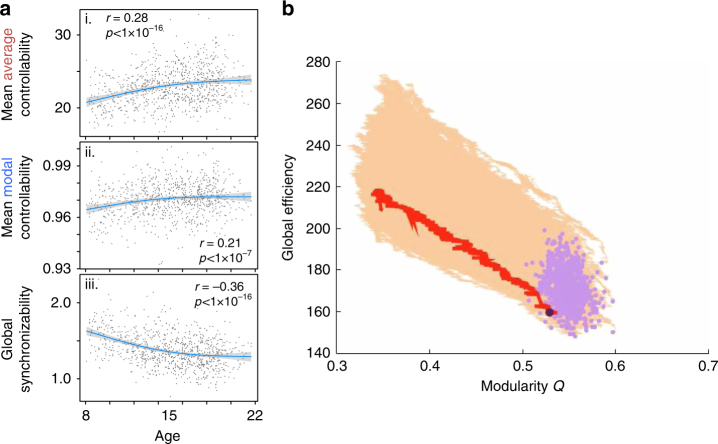
As the human brain develops, it increasingly supports coordinated control of neural activity. The mechanism by which white matter evolves to support this coordination is not well understood. Here we use a network representation of diffusion imaging data from 882 youth ages 8-22 to show that white matter connectivity becomes increasingly optimized for a diverse range of predicted dynamics in development. Notably, stable controllers in subcortical areas are negatively related to cognitive performance. Investigating structural mechanisms supporting these changes, we simulate network evolution with a set of growth rules. We find that all brain networks are structured in a manner highly optimized for network control, with distinct control mechanisms predicted in child vs. older youth. We demonstrate that our results cannot be explained by changes in network modularity. This work reveals a possible mechanism of human brain development that preferentially optimizes dynamic network control over static network architecture.


Conflict of interest statement

The authors declare no competing financial interests.

Figures

Fig. 1
Fig. 1
Controllability in brain networks. a Diffusion tensor imaging measures the direction of water diffusion in the brain. From this data, white matter streamlines can be reconstructed that connect brain regions in a structural network. b Mean average controllability: structural support for moving the brain to easy-to-reach states; mean modal controllability: structural support for moving the brain to difficult-to-reach states. c Regional average controllability ranked on N = 234 brain regions of a group-averaged network for visualization purposes. d Regions with high average controllability tend to display low modal controllability: ρ = −0.76, df = 233, p < 1 × 10−16; relative node strength is indicated by shape. e Controllability measures averaged over all regions in the brain networks of 882 healthy young subjects; each colored circle represents a person. People whose brains display high average controllability also tend to display high modal controllability: r = 0.87, df = 881, p < 1 × 10−16. Yellow and red ellipses are the 95% confidence clouds of network null models in which the edge weights of the brain networks are shuffled to preserve strength or degree, respectively
Fig. 2
Fig. 2
Synchronizability and changes across development. a A synchronous state is operationalized as a state in which all nodes have the same activity magnitude. Such a state is stable when the master stability function is negative for all positive eigenvalues of the graph Laplacian (Methods section). We use the inverse spread of the Laplacian eigenvalues 1/σ 2({λ i}) as a measure of global synchronizability. b Global synchronizability is anti-correlated with both average controllability and modal controllability (color of circles). Yellow and red ellipses are the 95% confidence clouds of the node-preserving and strength-preserving null models. c Mean average controllability significantly increases with age: Pearson’s correlation coefficient r = 0.28, df = 881, p < 1 × 10−16. d Global synchronizability significantly decreases with age: −0.37, df = 881, p < 1 × 10−16. The fits in panels c, d all control for brain volume, head motion, sex, and handedness. Blue lines show best non-linear fit under a general additive model (see Methods); gray envelope denotes 95% confidence interval
Fig. 3
Fig. 3
Regional specialization with age and its impact on cognition. a (Left) Regions of significantly increasing modal controllability with age (green) and significantly decreasing modal controllability with age (dark blue). (Right) The green regions tend to be stronger modal controllers (‘super-controllers’), as seen by the positive slope between the age correlation and regional modal controllability values. b (Left) Regions of significantly increasing average controllability with age (green) and significantly decreasing average controllability with age (dark blue). (Right) The green regions tend to be stronger average controllers (‘super-controllers’), as seen by the positive slope between the age correlation and regional average controllability values. c (Left) Super average controllers (green regions that significantly increase in controllability with age and tend to have higher average controllability) show little relation with cognitive performance (age-normed). The blue line denotes the best linear fit and the gray envelope denotes the 95% confidence interval. (Center) Super modal controllers also show little relation with cognitive performance. (Right) The regions that are most stable in controllability over development—subcortical regions—show a significant negative correlation between their average controllability and cognitive performance. These results suggest that the relative strength of controllers in subcortical vs. cortical regions is critical for understanding individual differences in overall cognitive function; i.e., a shift in control away from cortical regions may be detrimental to higher-order cognition. The fits in panel c all control for age, brain volume, head motion, sex, and handedness
Fig. 4
Fig. 4
Brain networks are optimized for diverse dynamics. a Pareto optimization explores a family of networks with different topologies and hence varying mean controllability and synchronizability (a few toy models illustrate this including a ring lattice R, regular lattice L, modular network M, and small-world network S). Pareto-optimal networks (purple dots) are the networks where these properties are most efficiently distributed, i.e., it is impossible to increase one property without decreasing another property—unlike in the non-optimal networks (green dots). The boundary connecting the Pareto-optimal networks forms the Pareto front (purple line). bd Beginning from an empirically measured brain network (purple dots), we swap edges to modify the topology and test if the modified network advances the Pareto front. This procedure charts a course of network evolution characterized by increasingly optimal features: here we increase mean average controllability and mean modal controllability, and decrease global synchronizability, in 1500 edge swaps (yellow curves). For comparison, we also evolved the network in the opposite direction (to decrease controllability and increase synchronzability, pink curves). The trajectory for one subject (blue dot) is highlighted (orange and red). See Methods section for evidence of convergence of controllability metrics in the forward direction after 1500 edge swaps
Fig. 5
Fig. 5
Brain networks show near-optimal control but finite synchronizability. The original brain networks (blue) and final evolved networks (orange) show overlap between their controllability values (first and second plots), however there is no overlap between the synchronizability values of these two groups (third plot)—suggesting that brain networks display near optimal control but retain a finite level of synchronizability
Fig. 6
Fig. 6
Specificity of controllability vs. degree. a As average (modal) controllability of each node is closely tied to high (low) weighted degree of that node, we repeat our optimization for maximum and minimum weighted degree in the network. b While the edge weight distribution of the network remains the same, edge swaps can alter the total degree of each node to increase the minimum (blue arrow) or maximum (red arrow) degree of the nodes. c, d The maximum and minimum weighted degree of each subject’s brain network are plotted as purple dots c and similarly for minimum weighted degree and synchronizability d—we see little structure or discernible relationship between individuals. We also plot representative optimization trajectories for each subject in the forward direction (yellow) in the cross section of increasing maximum weighted degree and decreasing minimum weighted degree c and decreasing minimum weighted degree and synchronizabililty d; as well as trajectories in the opposite direction (pink). The trajectory for a single representative individual is highlighted, for both forward (red) and backward (dark red) directions. We observe that this example trajectory takes a meandering path through the plane, displaying little structure
Fig. 7
Fig. 7
Steeper trajectories in children vs. youth ages 18–22. a We compare two cohorts of different ages, 170 children from ages 8–12 years (blue), and 190 youth from ages 18 to 22 years (green). Based on their forward Pareto-optimization trajectories, we fit exponential curves y = a + b exp (cx) for each subject, where x is the mean average controllability and y is the mean modal controllability, to obtain the curve tangent at the position of the brain network. The mean tangents of both groups are shown as dotted lines: the children’s in blue and the older youth’s in green. b The distribution of tangents for both groups shows that children have a 27% steeper slope in their optimization curves as compared to the youth ages 18–22; non-parametric permutation test p < 0.001. c This difference arises from the evolutionary curve in modal controllability, as can be seen by a separate examination of how modal controllability changes with each rewiring step (group difference in tangent: p < 0.001)—suggesting that children have a greater potential for increasing their ability to make distant or difficult changes in mental state than older youth. d In contrast, there is little group difference in the change of average controllability with each rewiring step (p = 0.47), suggesting that the potential to increase nearby mental switches remains constant over development
Fig. 8
Fig. 8
Ruling out a dependence on modular structure in our results. a Linear fits when including the modularity Q index as a covariate, for plots of (i) mean average controllability, (ii) mean modal controllability, and (iii) global synchronizability, respectively—their relationships with age are barely changed. b The Pareto-optimization of brain networks for the metrics of modularity Q and global efficiency does not display a similar functional form to the empirical data under these two metrics (the light purple dots). The simulated trajectories in the forward direction of these two metrics are shown in yellow. For illustration purposes, the large, dark purple dot and red trajectory indicate the result for a single individual

References

    1. Johansen-Berg H. Behavioural relevance of variation in white matter microstructure. Curr. Opin. Neurol. 2010;23:351–358. - PubMed
    1. Hermundstad AM, et al. Structurally-constrained relationships between cognitive states in the human brain. PLoS Comput. Biol. 2014;10:e1003591. doi: 10.1371/journal.pcbi.1003591. - DOI - PMC - PubMed
    1. Di Martino A, et al. Unraveling the miswired connectome: a developmental perspective. Neuron. 2014;83:1335–1353. doi: 10.1016/j.neuron.2014.08.050. - DOI - PMC - PubMed
    1. Baum, G. L. et al. Modular segregation of structural brain networks supports the development of executive function in youth. arXiv1608, 03619 (2016). - PMC - PubMed
    1. Sporns O. Contributions and challenges for network models in cognitive neuroscience. Nat. Neurosci. 2014;17:652–660. doi: 10.1038/nn.3690. - DOI - PubMed

Publication types