. 2017 Nov 1;7(1):14842.
doi: 10.1038/s41598-017-13861-8.

Cardio-audio synchronization drives neural surprise response

Affiliations

Cardio-audio synchronization drives neural surprise response

Christian Pfeiffer et al. Sci Rep. .

Abstract

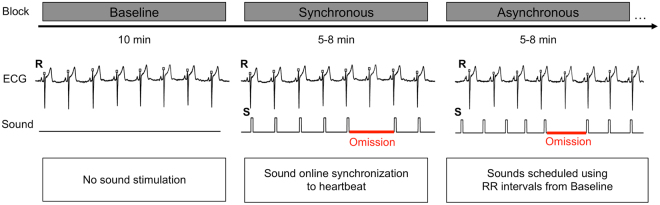
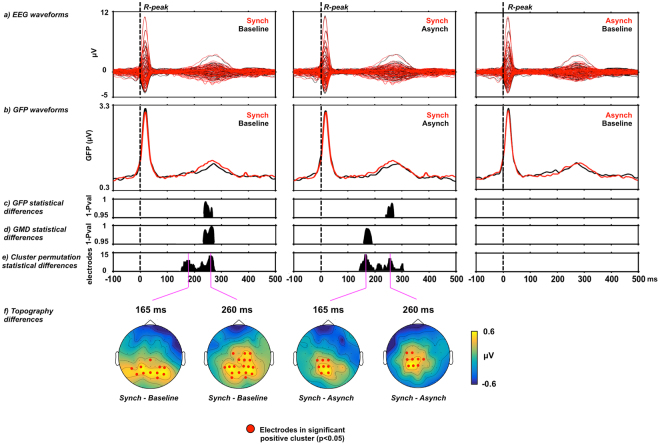
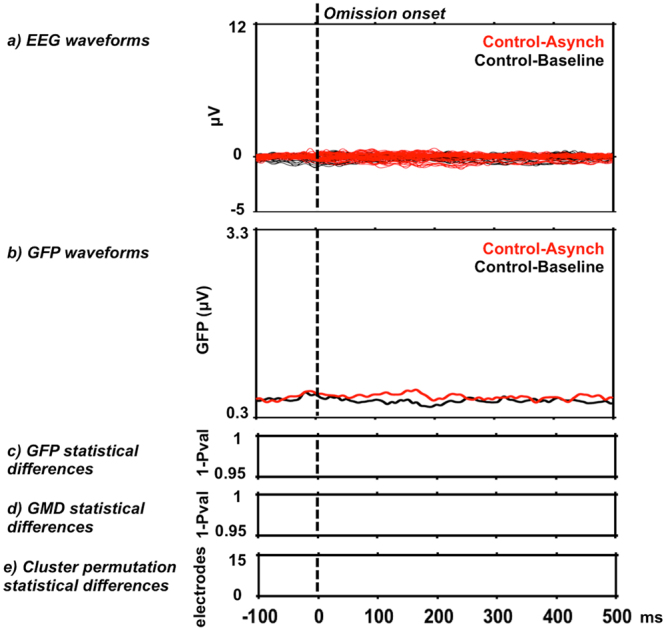
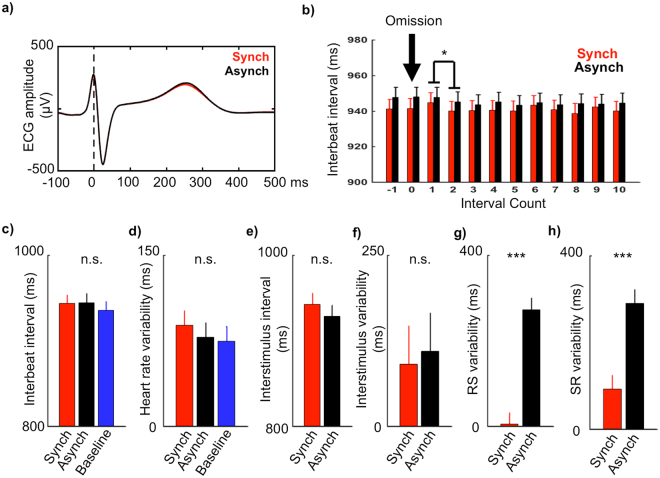
Successful prediction of future events depends on the brain's capacity to extract temporal regularities from sensory inputs. Neuroimaging studies mainly investigated regularity processing for exteroceptive sensory inputs (i.e. from outside the body). Here we investigated whether interoceptive signals (i.e. from inside the body) can mediate auditory regularity processing. Human participants passively listened to sound sequences presented in synchrony or asynchrony to their heartbeat while concomitant electroencephalography was recorded. We hypothesized that the cardio-audio synchronicity would induce a brain expectation of future sounds. Electrical neuroimaging analysis revealed a surprise response at 158-270 ms upon omission of the expected sounds in the synchronous condition only. Control analyses ruled out that this effect was trivially based on expectation from the auditory temporal structure or on differences in heartbeat physiological signals. Implicit neural monitoring of temporal regularities across interoceptive and exteroceptive signals drives prediction of future events in auditory sequences.


Conflict of interest statement

The authors declare that they have no competing interests.

Figures

Figure 1
Figure 1
Experimental design and procedure. Exemplar experimental block order for the initial three out of a total of six blocks are shown in the top row. Electrocardiography (ECG) recordings superimposed with detected R peaks (i.e. R) are shown alongside with sound stimulation periods (S). Sound omission periods are highlighted in red color. Description of the sound stimulation methods for each experimental block is indicated at the bottom.
Figure 2
Figure 2
Electrical neuroimaging results for Heartbeat-Evoked Potentials (HEP) during sound omission. (a) Group-average EEG waveforms (N = 16) showing HEPs for the comparison of Synchronous (in red) versus Baseline trials (in black; left column), for Synchronous (in red) versus Asynchronous trials (in black; center column), and for Asynchronous (in red) versus Baseline (in black; right column). (b) Group-average Global Field Power waveforms (GFP) (c) GFP statistical differences (p < 0.05 corrected for minimum duration criterion), (d) GMD statistical differences (p < 0.05 corrected for minimum duration criterion), (e) cluster permutation results showing the count of electrodes in the significant positive cluster (p < 0.05) and (f) exemplar topography differences (Synch - Baseline and Synch - Asynch) for the peaks of significant electrode count with significant electrodes highlighted in red.
Figure 3
Figure 3
Electrical neuroimaging results for sound-based omission in Asynchronous blocks. (a,b) Group-average EEG and GFP waveforms of omission trials from Asynchronous blocks (Control-Asynch, in red) with onset at a latency occurring during the omission at the average interstimulus interval. Control-Baseline trials (in black) were randomly selected with onset matched for R peak onset of single trials. (ce) Statistical analyses by time-wise GFP, GMD and cluster permutation tests showed no significant differences between sound-based omission in Control-Asynch vs. Control-Baseline condition.
Figure 4
Figure 4
Control analyses results. (a) Group-average ECG waveform (N = 16) time-locked to R peaks during sound omission for Synchronous (in red) and Asynchronous (in black) conditions superimposed. (b) Interbeat intervals before, during and after omission for Synchronous (in red) and Asynchronous (in black) conditions. (ch) Interbeat intervals, heart rate variability, interstimulus intervals, interstimulus variability, RS variability for sound trials, and SR variability for omission trials compared across experimental conditions (*p < 0.05, ***p < 0.001; n.s. = not significant).

References

    1. Garrido MI, Kilner JM, Stephan KE, Friston KJ. The mismatch negativity: a review of underlying mechanisms. Clin Neurophysiol. 2009;120:453–463. doi: 10.1016/j.clinph.2008.11.029. - DOI - PMC - PubMed
    1. Näätänen R, Paavilainen P, Rinne T, Alho K. The mismatch negativity (MMN) in basic research of central auditory processing: a review. Clin Neurophysiol. 2007;118:2544–2590. doi: 10.1016/j.clinph.2007.04.026. - DOI - PubMed
    1. Tzovara A, et al. Prediction of awakening from hypothermic post anoxic coma based on auditory discrimination. Annals of neurology. 2016;79:748–757. doi: 10.1002/ana.24622. - DOI - PubMed
    1. Tzovara A, et al. Progression of auditory discrimination based on neural decoding predicts awakening from coma. Brain. 2013;136:81–89. doi: 10.1093/brain/aws264. - DOI - PubMed
    1. Tzovara A, Simonin A, Oddo M, Rossetti AO, De Lucia M. Neural detection of complex sound sequences in the absence of consciousness. Brain. 2015;138:1160–1166. doi: 10.1093/brain/awv041. - DOI - PMC - PubMed

Publication types

LinkOut - more resources