

A solar radiation database for Chile
- PMID: 29093511
- PMCID: PMC5665918
- DOI: 10.1038/s41598-017-13761-x
A solar radiation database for Chile
Abstract
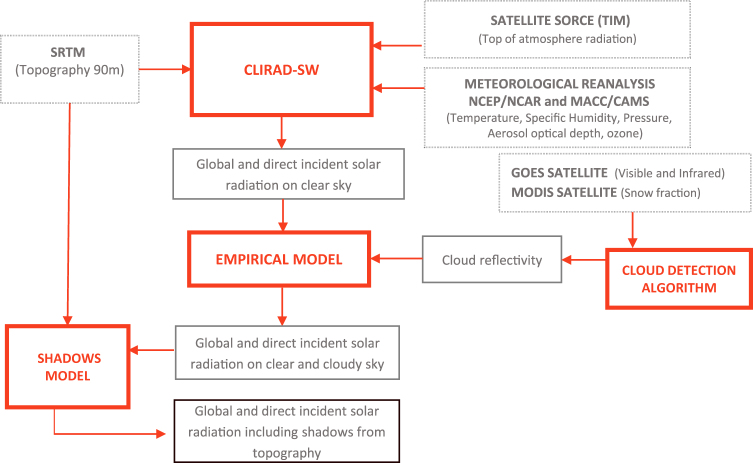
Chile hosts some of the sunniest places on earth, which has led to a growing solar energy industry in recent years. However, the lack of high resolution measurements of solar irradiance becomes a critical obstacle for both financing and design of solar installations. Besides the Atacama Desert, Chile displays a large array of "solar climates" due to large latitude and altitude variations, and so provides a useful testbed for the development of solar irradiance maps. Here a new public database for surface solar irradiance over Chile is presented. This database includes hourly irradiance from 2004 to 2016 at 90 m horizontal resolution over continental Chile. Our results are based on global reanalysis data to force a radiative transfer model for clear sky solar irradiance and an empirical model based on geostationary satellite data for cloudy conditions. The results have been validated using 140 surface solar irradiance stations throughout the country. Model mean percentage error in hourly time series of global horizontal irradiance is only 0.73%, considering both clear and cloudy days. The simplicity and accuracy of the model over a wide range of solar conditions provides confidence that the model can be easily generalized to other regions of the world.
Conflict of interest statement
The authors declare that they have no competing interests.
Figures


References
-
- Rondanelli R, Molina A, Falvey M. The Atacama surface solar maximum. Bulletin of the American Meteorological Society. 2015;96:405–418. doi: 10.1175/BAMS-D-13-00175.1. - DOI
-
- Del Campo, S. Estrategia Nacional de Energía 2012–2030. Ministerio de Energía (In Spanish. http://www. minenergia. cl/estrategia-nacional-de-energia-2012. html) (2012).
-
- de Energía, M. Energía 2050 política energética de Chile. Ministerio de Energía (In Spanish. http://www.energia2050. cl) (2016).
-
- Lapo, K. E., Hinkelman, L. M., Sumargo, E., Hughes, M. & Lundquist, J. D. A critical evaluation of modeled solar irradiance over California for hydrologic and land surface modeling. Journal of Geophysical Research: Atmospheres 122, 299–317 URL http://dx.doi.org/10.1002/2016JD025527 doi:https://doi.org/10.1002/2016JD025527. 2016JD025527 (2017). - DOI
-
- Bodas-Salcedo, A. et al. Origins of the solar radiation biases over the southern ocean in CFMIP2 models. Journal of Climate27, 41–56 http://dx.doi.org/10.1175/JCLI-D-13-00169.1 DOI 10.1175/JCLI-D-13-00169.1 (2014). - DOI
Publication types
LinkOut - more resources
Full Text Sources
Other Literature Sources
