

Modeling rater diagnostic skills in binary classification processes
- PMID: 29094378
- PMCID: PMC5771896
- DOI: 10.1002/sim.7530
Modeling rater diagnostic skills in binary classification processes
Abstract
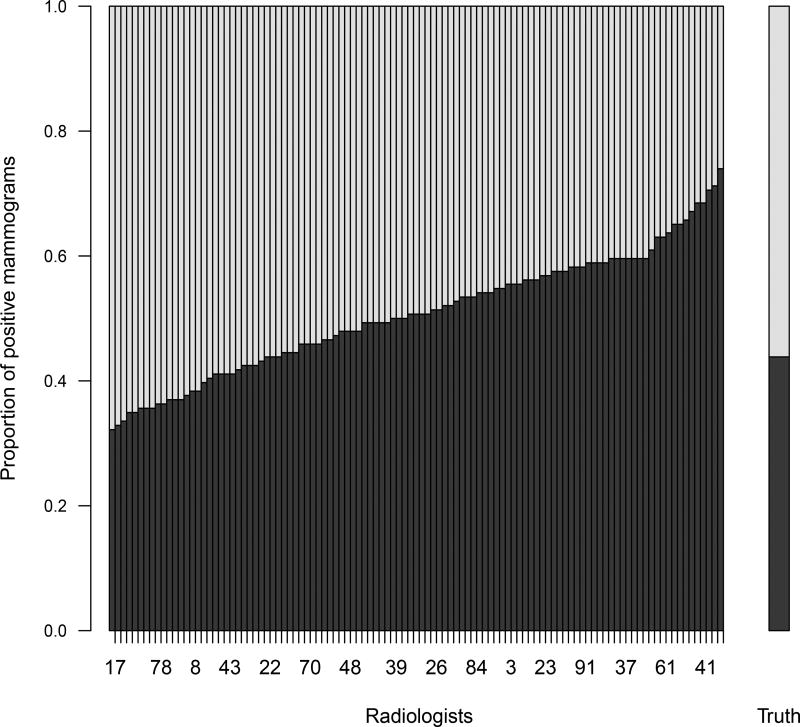
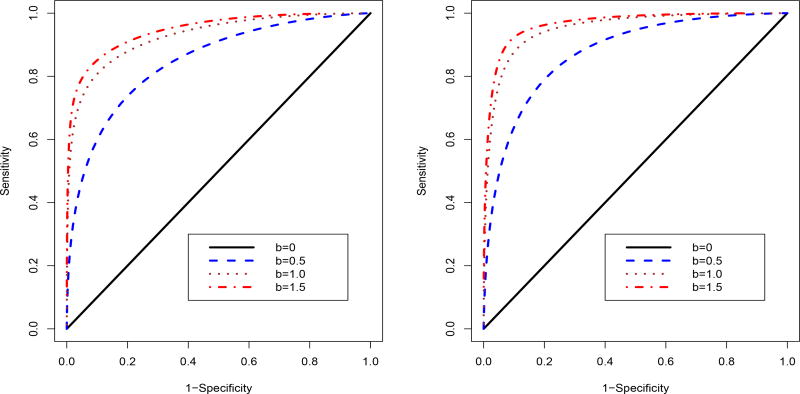
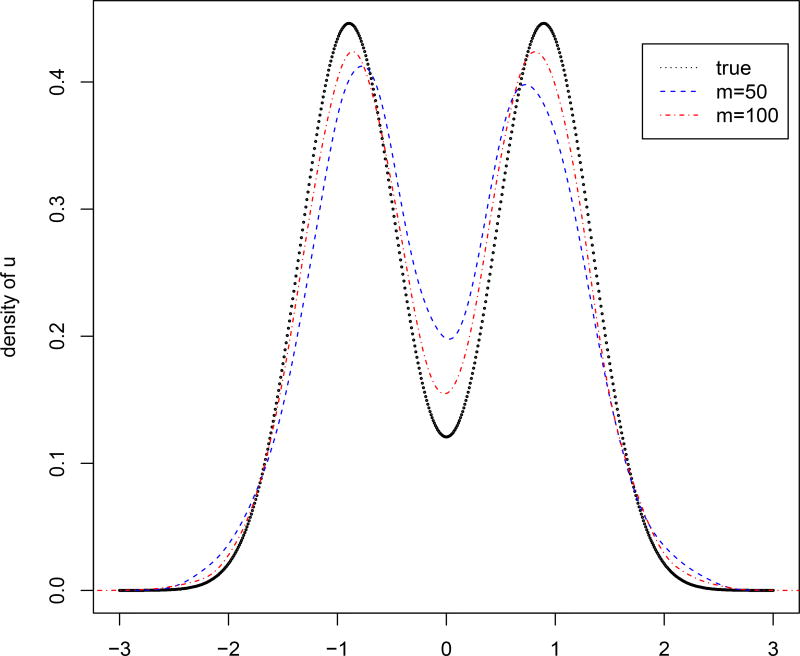
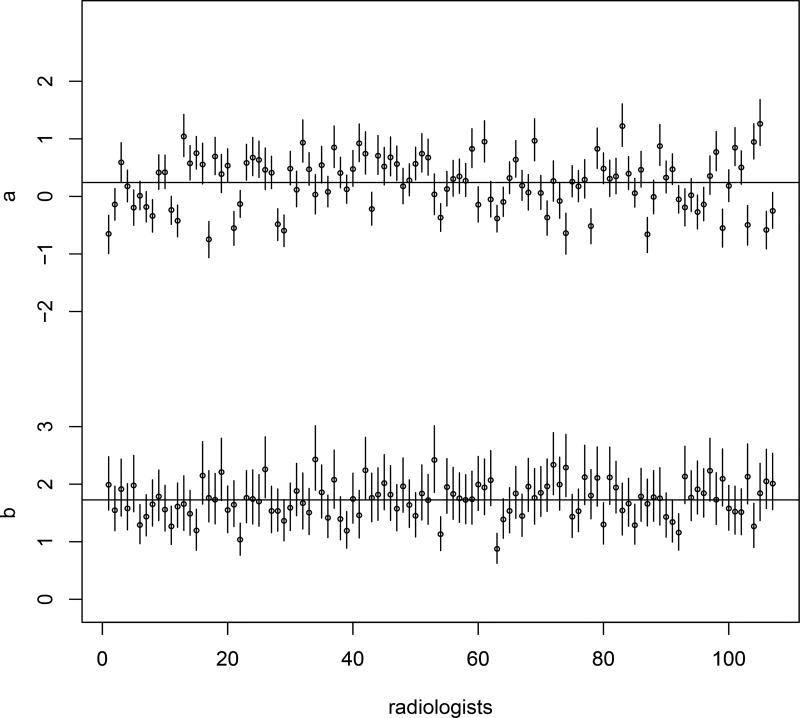
Many disease diagnoses involve subjective judgments by qualified raters. For example, through the inspection of a mammogram, MRI, or ultrasound image, the clinician himself becomes part of the measuring instrument. To reduce diagnostic errors and improve the quality of diagnoses, it is necessary to assess raters' diagnostic skills and to improve their skills over time. This paper focuses on a subjective binary classification process, proposing a hierarchical model linking data on rater opinions with patient true disease-development outcomes. The model allows for the quantification of the effects of rater diagnostic skills (bias and magnifier) and patient latent disease severity on the rating results. A Bayesian Markov chain Monte Carlo (MCMC) algorithm is developed to estimate these parameters. Linking to patient true disease outcomes, the rater-specific sensitivity and specificity can be estimated using MCMC samples. Cost theory is used to identify poor- and strong-performing raters and to guide adjustment of rater bias and diagnostic magnifier to improve the rating performance. Furthermore, diagnostic magnifier is shown as a key parameter to present a rater's diagnostic ability because a rater with a larger diagnostic magnifier has a uniformly better receiver operating characteristic (ROC) curve when varying the value of diagnostic bias. A simulation study is conducted to evaluate the proposed methods, and the methods are illustrated with a mammography example.
Keywords: ROC; cost theory; diagnostic bias; diagnostic magnifier; disease severity.
Copyright © 2017 John Wiley & Sons, Ltd.
Figures


References
-
- Bamber D. The area above the ordinal dominance graph and the area below the receiver operating characteristic graph. Journal of Mathematical Psychology. 1975;12:387–415.
-
- Hanley JA, McNeil BJ. The meaning and use of the area under a receiver operating characteristic (ROC) curve. Radiology. 1982;143:29–36. - PubMed
-
- Mossman D. Three-way ROCs. Medical Decision Making. 1999;19:78–89. - PubMed
-
- Obuchowski NA, Goske MJ, Applegate KE. Assessing physicians’ accuracy in diagnosing pediatric patients with acute abdominal pain: measuring accuracy for multiple disease. Statistics in Medicine. 2001;20:3261–3278. - PubMed
Publication types
MeSH terms
Grants and funding
LinkOut - more resources
Full Text Sources
Other Literature Sources
Medical