. 2017 Nov 2;551(7678):51-56.
doi: 10.1038/nature24281. Epub 2017 Sep 27.

Two independent modes of chromatin organization revealed by cohesin removal

Affiliations

Two independent modes of chromatin organization revealed by cohesin removal

Wibke Schwarzer et al. Nature. .

Abstract

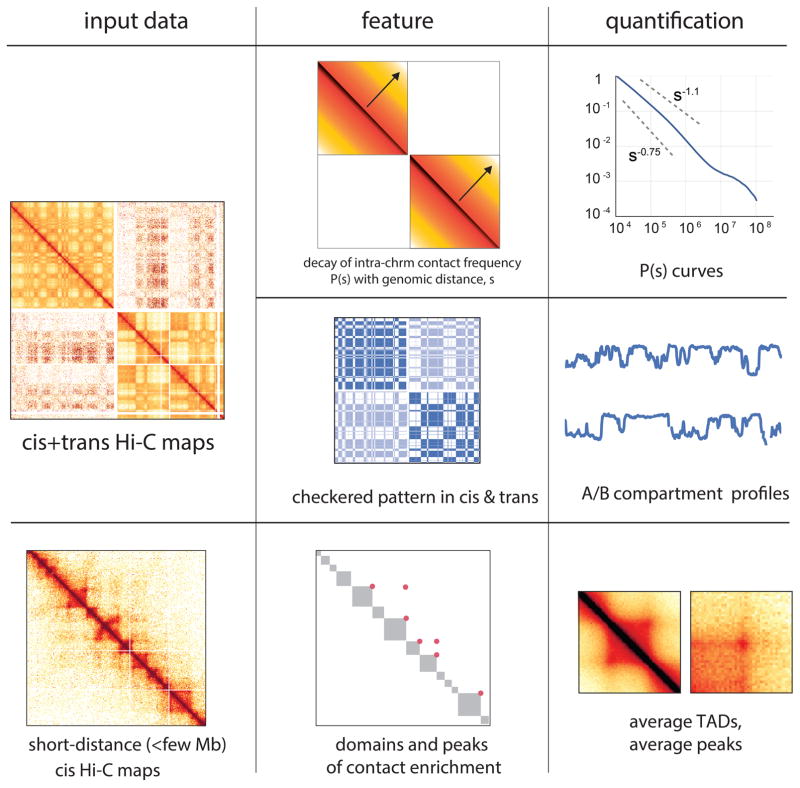
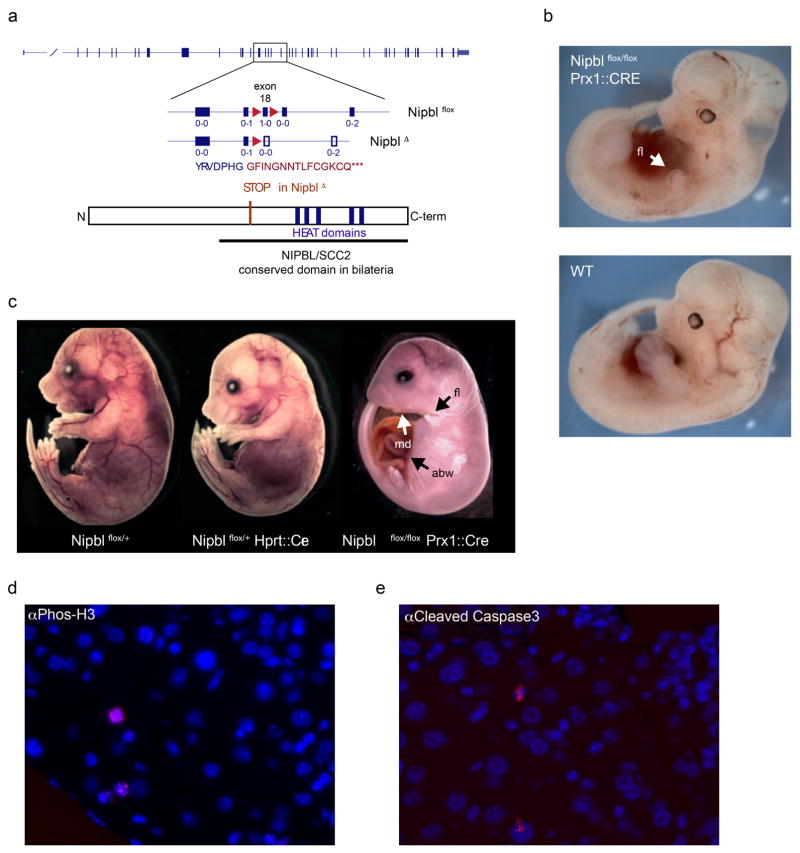
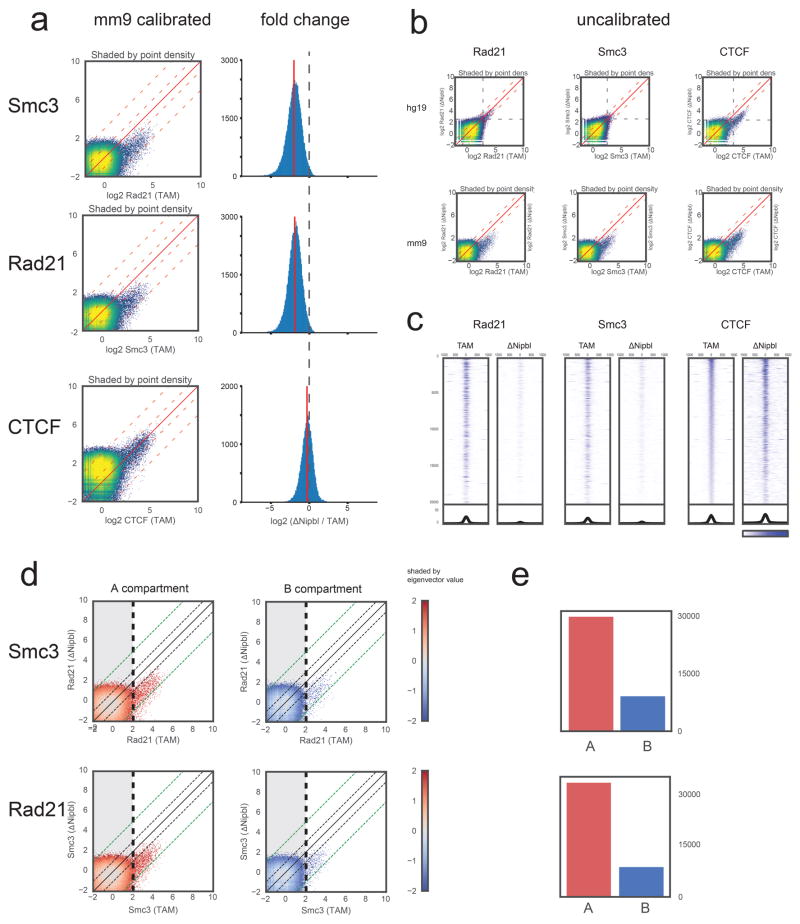
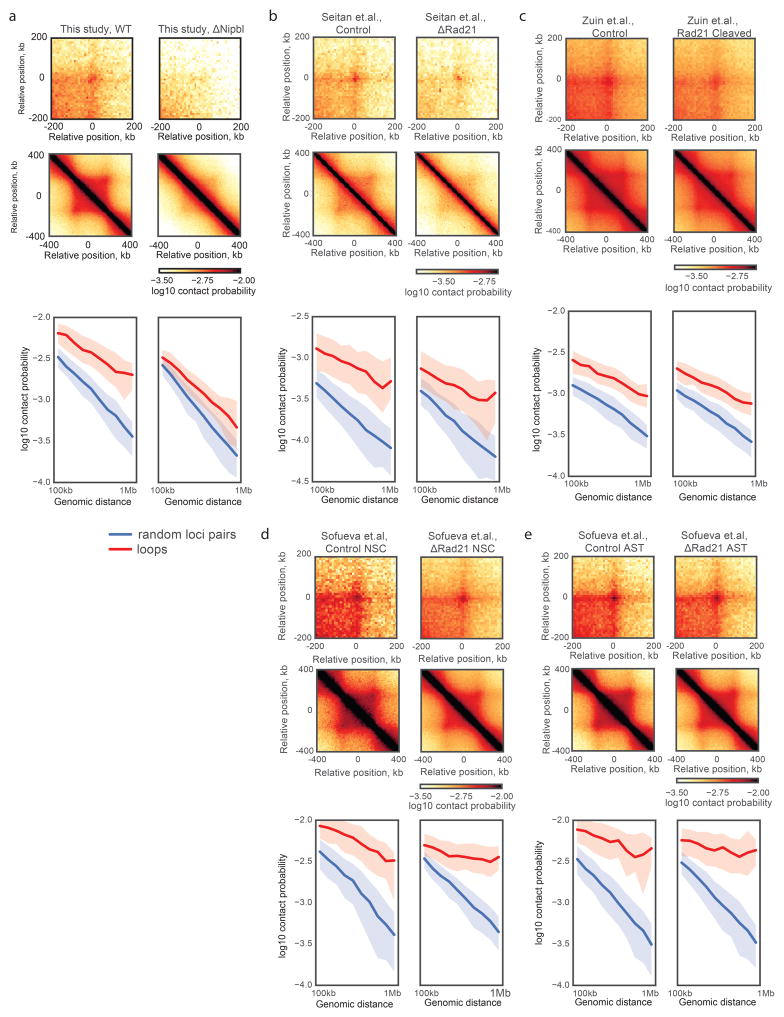
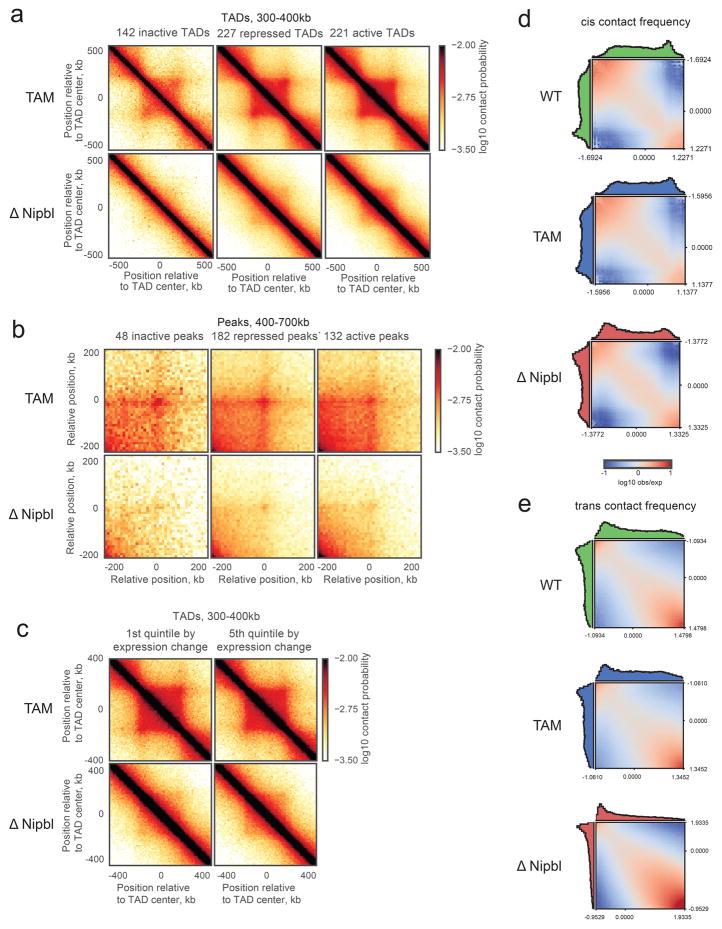
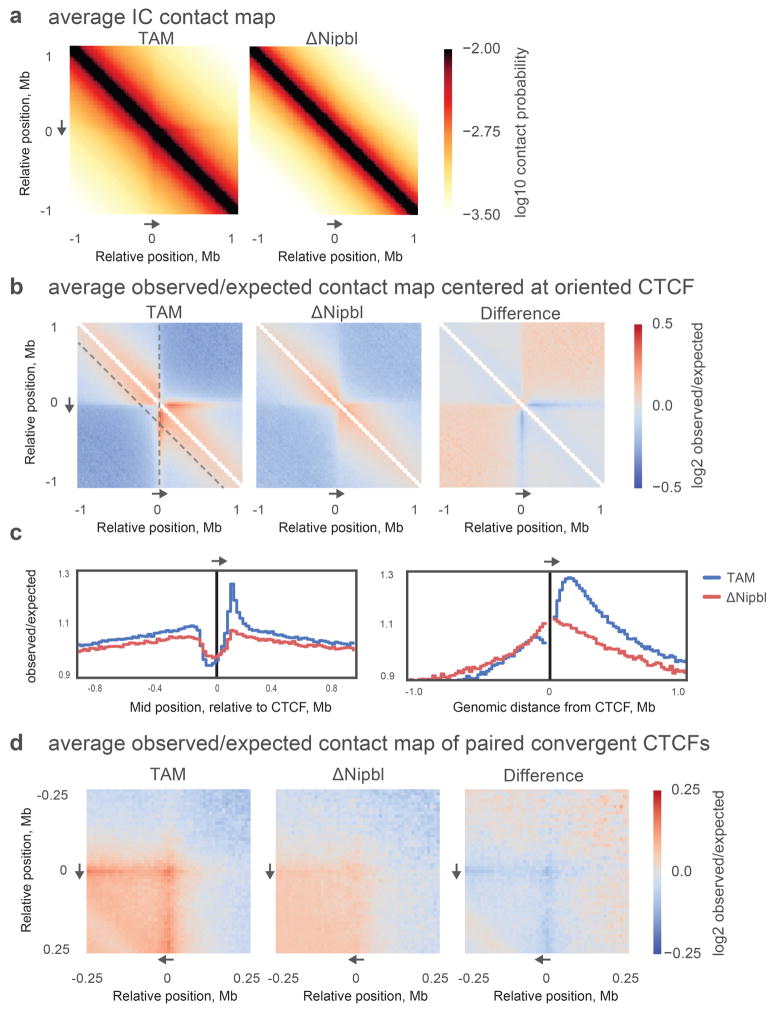
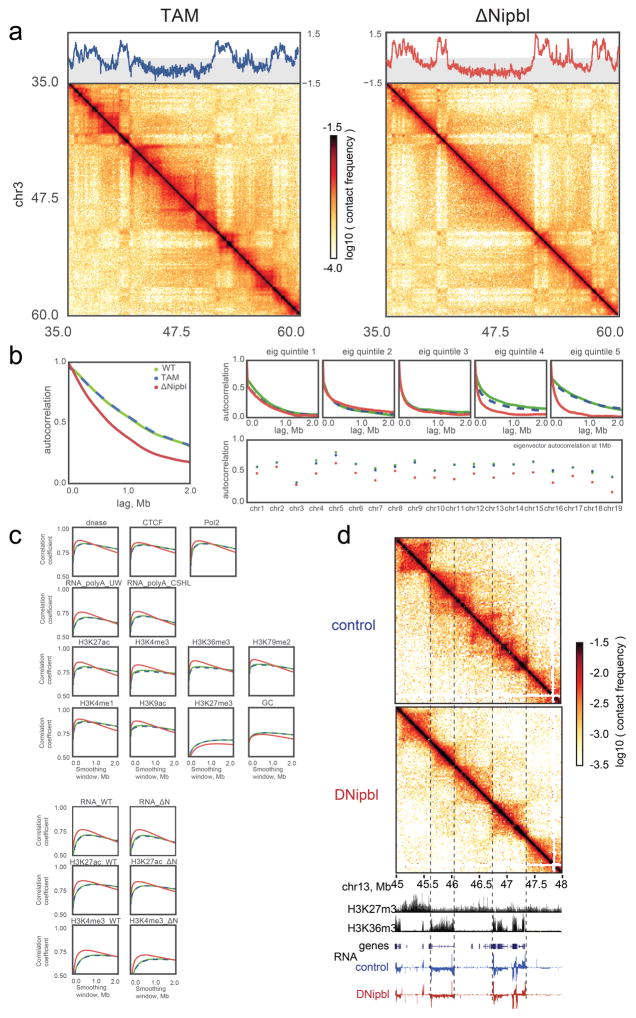
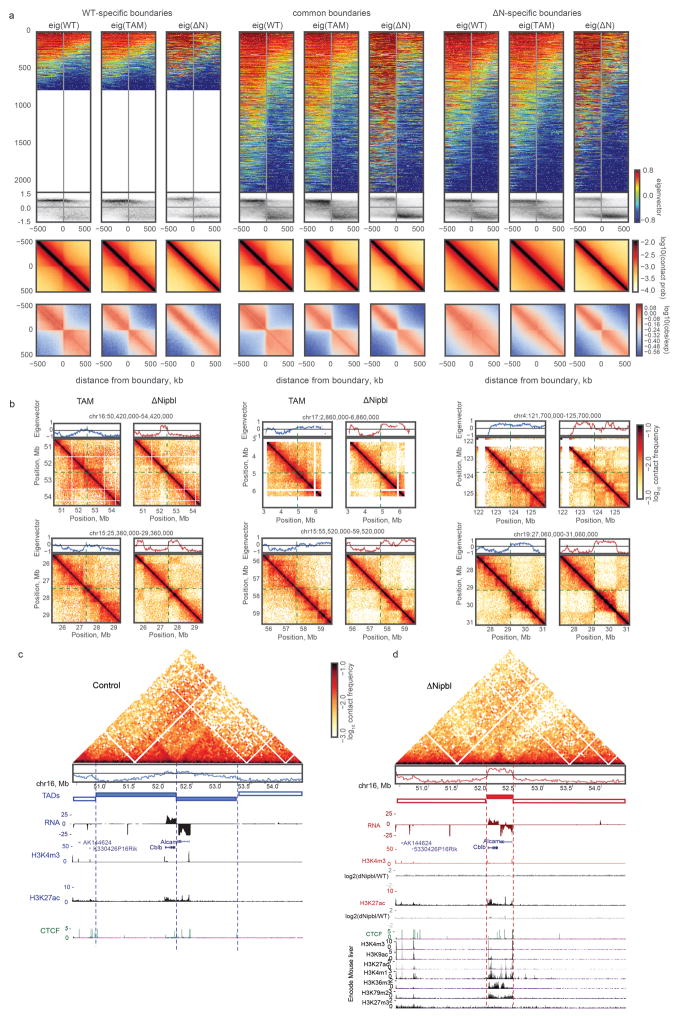
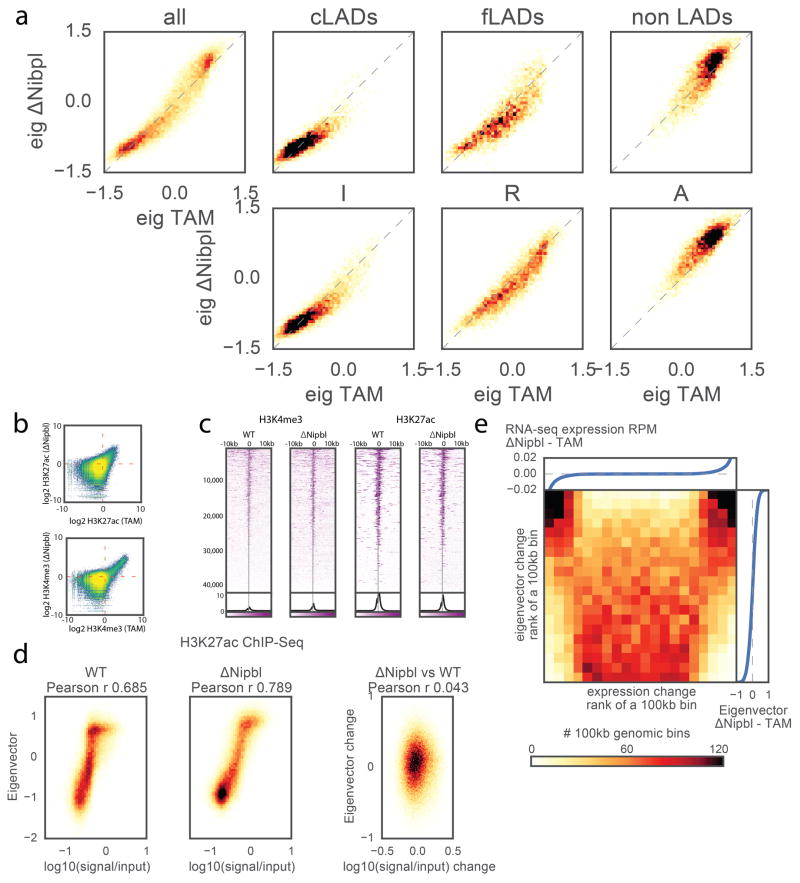
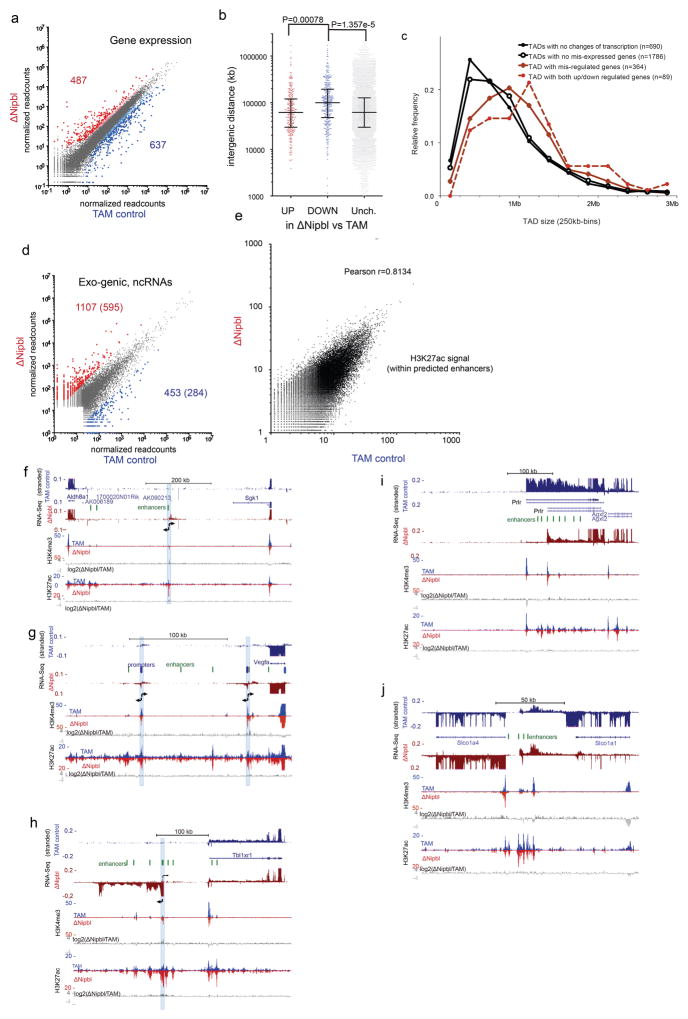
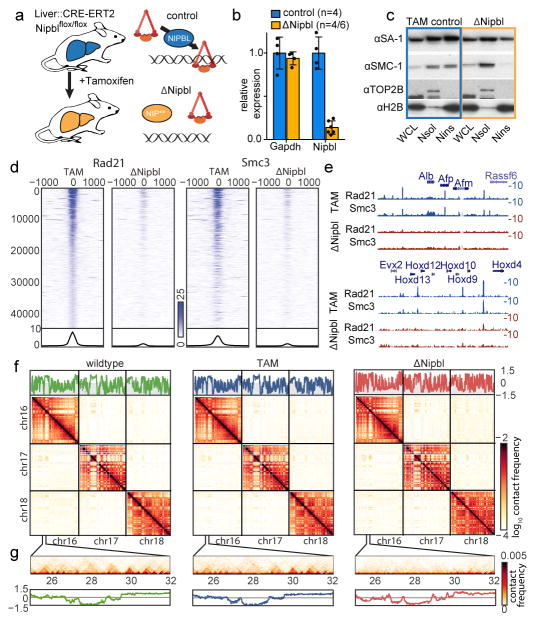
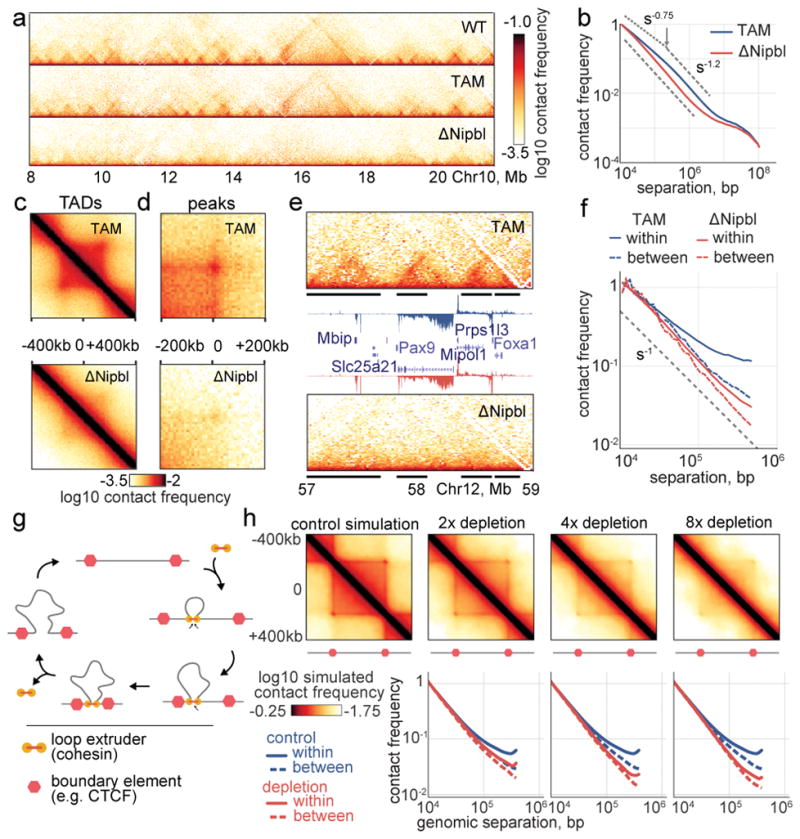
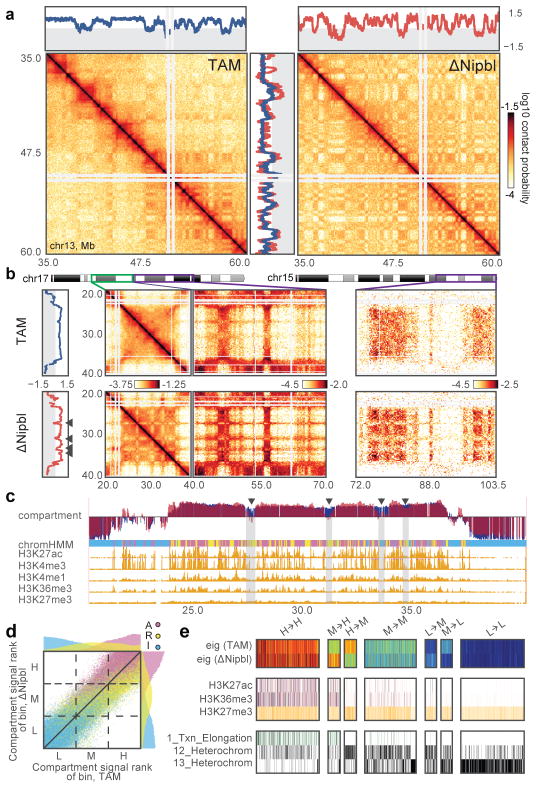
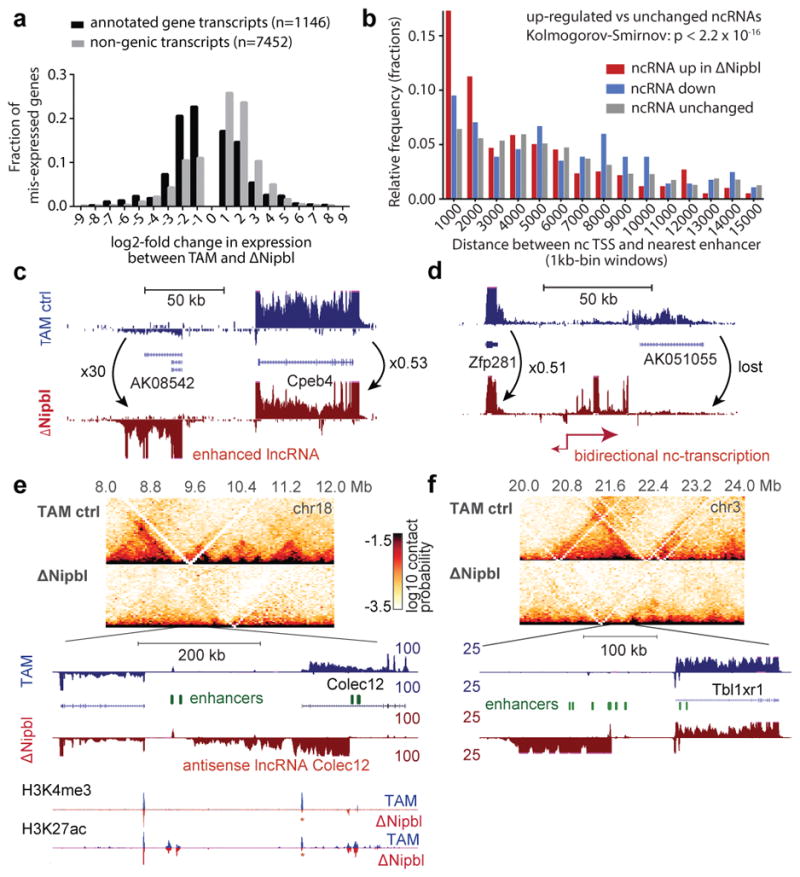
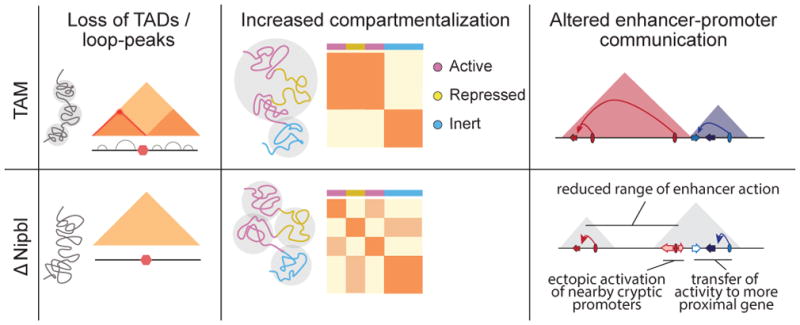
Imaging and chromosome conformation capture studies have revealed several layers of chromosome organization, including segregation into megabase-sized active and inactive compartments, and partitioning into sub-megabase domains (TADs). It remains unclear, however, how these layers of organization form, interact with one another and influence genome function. Here we show that deletion of the cohesin-loading factor Nipbl in mouse liver leads to a marked reorganization of chromosomal folding. TADs and associated Hi-C peaks vanish globally, even in the absence of transcriptional changes. By contrast, compartmental segregation is preserved and even reinforced. Strikingly, the disappearance of TADs unmasks a finer compartment structure that accurately reflects the underlying epigenetic landscape. These observations demonstrate that the three-dimensional organization of the genome results from the interplay of two independent mechanisms: cohesin-independent segregation of the genome into fine-scale compartments, defined by chromatin state; and cohesin-dependent formation of TADs, possibly by loop extrusion, which helps to guide distant enhancers to their target genes.


Conflict of interest statement

The authors declare no competing financial interests.

Figures

Extended Data Figure 1
Extended Data Figure 1. Overview of various features of chromosomal architecture detected and quantified in Hi-C contact maps
Top row – intra-chromosomal maps show the decay of contact frequency with genomic distance, which can be quantified with the curves of contact frequency P(s) vs genomic separation s. Middle row – both intra- and inter-chromosomal maps display a checkered pattern caused by compartmentalization of the genome. This pattern can be quantified by a continuous genomic track obtained via eigenvector decomposition of either cis or trans maps. Bottom row – intra-chromosomal maps at short genomic distance scales reveal domains of enriched contact frequency, which appear as bright squares along the main diagonal, and peaks which appear as bright dots connecting two loci. Both can be detected and quantified using specialized algorithms.
Extended Data Figure 2
Extended Data Figure 2. Conditional inactivation of Nipbl in mice
(a) Schematic representation of the conditional allele, with loxP sites (red triangles) flanking exon 18. The reading frame of each exon is indicated below the corresponding square, as “x-x”. Deletion of exon 18 leads to a frame-shift introducing a premature stop codon (indicated by amino acids in red). The resulting protein lacks the critical HEAT domains conserved in NIPBL/SCC2 proteins. (b–c) E12 embryos (b) and E18 fetuses (c) carrying the conditional Nipbl allele (Nipblflox) and either ubiquitous (Hprt:Cre ) or limb-specific (Prx1::Cre ) Cre recombinase drivers. Structures expressing Cre are rapidly lost in Nipblflox/flox animals. Heterozygous Nipblflox/+ animals are grossly morphologically normal, but die soon after birth, as reported for other Nipbl loss of function alleles . fl=forelimb; md:mandibule; abw=abdominal wall. (d–e) Histochemical staining of liver section of adult ΔNipbl hepatocytes (Nipblflox/flox; Ttr::CreERT2; 10 days after Tamoxifen injection) for a proliferation marker (Phos-H3) (d) and apoptosis (cleaved Caspase3) (e) (both showed in red). Nuclei are stained with DAPI (blue). Staining were performed once.
Extended Data Figure 3
Extended Data Figure 3. Calibrated ChIP-seq for CTCF and cohesin (Rad21 and Smc3)
(a) Left: Comparison of calibrated mouse ChIP-seq data. For each factor (CTCF, Rad21, Smc3), we used the ratio of the top 0.2% of 200bp bins (~29,000 points) in the TAM hg19 fraction vs the ΔNipbl hg19 fraction to rescale the mm9 signal in the ΔNipbl condition in order to be compared with the mm9 signal in the TAM condition (see Methods). The scatter plot heatmaps in the left column are shaded by point density. Right: Log2 fold difference ratio between ΔNipbl and TAM for ChIP-seq peaks (points in with ChIP in TAM>2.0). While the calibrated CTCF binding signal stays relatively constant between conditions (within the 2-fold envelope), most of the calibrated cohesin binding signal drops by ~2–8 fold in ΔNipbl, with a mean depletion rate of 3.7 fold. (b) Uncalibrated ChIP-seq reads used for the calibration human cell (hg19, left) and mouse (mm9, right). Processed mapped reads were converted to genome-wide signal tracks binned at 200bp resolution. Scatter plots of these genomic tracks (TAM vs ΔNipbl) are shown as heatmaps shaded by point density. For cohesin subunits, the hg19 signal has a similar profile in both conditions, but the ΔNipbl signal is diminished in the uncalibrated mm9 fraction. The uncalibrated mm9 signal appears to go down in ΔNipbl for CTCF as well; however, a similar diminishing effect is seen in the hg19 data. (c) Stacked heatmaps of calibrated ChIP-seq signal at the top 20,000 CTCF binding sites (peaks with an assigned CTCF motif), ranked by fold change over input in the TAM control condition. (d) Scatter plots of calibrated ChIP-seq tracks as in (b), but split into two groups by compartment type A (compartment eigenvector>0) and B (eigenvector assignment < 0). The shading is colored by the eigenvector signal. Black and green dashed diagonal lines demarcate the 2-fold and 8-fold envelopes, respectively. (e) Total cohesin occupancy. Bar plot showing the number of ChIP-seq 200bp points in the non-shaded area of the scatter plots (bins with TAM signal > 2) representing high confidence binding signal in WT. While cohesin binding is more than 3-fold more prevalent in A-compartment regions, the scatter plots show that both A and B regions respond equally to Nipbl deletion.
Extended Data Figure 4
Extended Data Figure 4. Deletion of Nipbl in this study leads to a more robust disappearance of TADs and associated peaks as compared to previous techniques
(a) genetic deletion of Nipbl in hepatocytes, this study. (b) deletion of Rad21 in thymocytes . (c) proteolytic cleavage of RAD21 in HEK293T cells (d–e) deletion of Rad21 in NSCs and ASTs . For each dataset: left column, top panels – the average Hi-C map around 102 peaks with size range 500–600kb in WT and ΔNipbl contact maps; middle panels – the average Hi-C map of TADs called in each dataset; bottom panels – the relative contact probability between pairs of peak loci vs genomic distance, compared to randomly selected pairs of loci. The thick line shows the median contact probability; the shading shows the envelope between the 25th and 75th percentiles of contact probability at each genomic separation. Note significant changes in the contact probability at peaks (red line) upon Nipbl depletion (a) and little changes in other studies (b–e). All studies used comparable Hi-C sequencing depth (Supplementary Table 3)
Extended Data Figure 5
Extended Data Figure 5. Residual structures are observed in active and repressed regions of the genome after Nipbl deletion
For each TAD, an activity was assigned based on the dominant simplified ChromHMM state category. (a) The average contact map of 300–400kb TADs in inert, repressed and active regions of the genome. (b) The average contact map of 300–700kb peaks in inert, repressed and active regions of the genome. (c) The average contact maps of most upregulated 20% (left) and most downregulated 20% (right) of 300–400kb TADs. (d) Compartmentalization saddle plots: average interaction frequencies between pairs of loci (100kb bins) arranged by their compartment signal (eigenvector value). The interaction frequencies in cis (top row) are computed for observed/expected contact maps. Notice enrichment of AA and depletion of AB interactions in ΔNipbl cells. Histograms along the axes show the distributions of eigenvector values.
Extended Data Figure 6
Extended Data Figure 6. The average Hi-C contact footprint of CTCF sites
CTCF peaks were detected in our ChIP-Seq data from TAM control cells and supported by an underlying CTCF binding motif occurrence. (a) Average iteratively corrected 20kb-resolution contact map of around ~42,000 CTCF peaks in TAM and ΔNipbl cells. Individual contributing snippets to the composite heatmap were oriented such that the CTCF motif points in the direction shown by the grey arrow. (b) Average 20kb-resolution contact map normalized by the expected contact frequency at a given genomic separation. (c) Average observed over expected contact frequency curves along “slices” of the composite heatmaps depicted by dashed grey lines in (b): left panel – the insulation profile at 200kb separation (diagonal dashed line on (b)), right panel – the “virtual 4C” curve (vertical dashed line on (b)) of the composite heatmap. (d) Average 10kb-resolution observed over expected contact map centered on ~11,000 pairs of CTCF ChIP-seq peaks with convergent motif orientations separated by 200 +/− 10kb.
Extended Data Figure 7
Extended Data Figure 7. Fragmentation upon Nipbl deletion in smaller alternating regions of A and B compartment-type is activity-dependent
(a) Example region (chr3:35–60Mb) illustrating lack of compartment fragmentation in predominantly B-type regions yet robust disappearance of TADs. Top – compartment eigenvector, Bottom – contact matrix snapshot. (b) Autocorrelation of eigenvector tracks reveals genome-wide fragmentation of active compartments. Left – the genome-wide Spearman coefficient of correlation of the 20kb cis eigenvector values (n=113,372) of pairs of loci as a function of their genomic separation (autocorrelation). Top right – eigenvector correlation of locus pairs split by quintile of the eigenvector value of the upstream locus. Bottom right – chromosome-wide values of eigenvector correlation of locus pairs separated by 1Mb. (c) Spearman coefficient of correlation between the smoothed histone and TF ChIP-seq and RNA-seq tracks and the 20kb cis eigenvectors (n=113,372) as a function of the smoothing window size. Left group of panels – ENCODE data, right – data from this study. First and second rows – histone marks, third row – RNA-seq tracks, fourth row – miscellaneous tracks (DNase hypersensitivity, CTCF and PolII ChIP-seq and GC content). ΔNipbl eigenvectors show an increased correlation with tracks associated with transcriptional activity yet a decreased correlation with the repression-associated track of H3K27me3 and GC content. (d) An example of a large WT A-type compartment region (chr13:45–48Mb). ΔNipbl compartment transitions highlighted by black dashed lines. TAD boundaries in the WT are shifted or lost and replaced by compartment transitions in ΔNipbl cells. Histone ChIP-seq tracks and stranded RNA-seq tracks (blue: TAM hepatocytes, red; ΔNipbl cells) highlight that WT/TAM TADs do not strictly follow the underlying chromatin activities, whereas the new checkered pattern in ΔNipbl cells delineated bydashed lines correspond precisely to active versus inactive chromatin domains. In (a) and (d), both replicates of each condition show similar results.
Extended Data Figure 8
Extended Data Figure 8. TADs and compartments constitute independent layers of genome organization
(a) The residual contact-insulating boundaries in ΔNipbl are associated with compartment transitions. The first group of columns considers the boundaries detected in WT cells only, the second pair considers boundaries detected both in WT and ΔNipbl cells, the last pair considers boundaries detected in ΔNipbl only. For each group, the first, second and third columns display data (eigenvectors and Hi-C) from WT, TAM and ΔNipbl cells, respectively. Within each column: the top row – a stack of eigenvector tracks in a +/− 500kb window around boundaries, oriented such that the left-half of the window has greater average signal value and sorted by the average WT eigenvector value in the window. The second row – density histogram of eigenvector values as a function of the distance to the boundary. The third and fourth row – the boundary-centered average contact probability and observed/expected contact ratio, respectively. The density histograms show that common and ΔNipbl-specific boundaries correspond to sharp transitions of compartment signals in ΔNipbl cells, in contrast to the more diffuse signal at these positions in WT and TAM cells. (b) Boundaries of former TADs and new compartment domains do not coincide. Examples of TADs detected in WT cells, which contain cross sharp compartment transitions revealed by ΔNipbl contact maps. Left column – TAM control data, right column – ΔNipbl data. Top of each figure – local compartment signal in the corresponding cell type. The contact maps are centered at the sharp compartment transition in ΔNipbl. These examples illustrate that that chromatin-bound cohesins can locally interfere with genome compartmentalization. (c, d) New compartments do not respect TAD boundaries but the underlying chromatin domains. A large region (chr16:50420000–54420000) adopts a very different 3D organization in control (c) (in blue) and ΔNipbl cells (d) (in red). Hi-C data are shown, as well as the eigenvector values in the two conditions. RNA-Seq tracks showed minimal changes of expression (Alcam expression is reduced by 2-fold in ΔNipbl cells) and chromatin states. ChIP-Seq tracks for H3K27ac and H3K4me3 are shown in the two conditions, with log2 ratio tracks under the ΔNipbl (d) panel. Encode tracks (corresponding to WT liver cells) are shown in the grey boxed area. The new structure adopted in ΔNipbl cells put together the two active genes which are normally in different TADs in the same domain, corresponding to the active chromatin linear domain. In (b–d), both replicates of each condition show similar result.
Extended Data Figure 9
Extended Data Figure 9. Eigenvector change upon Nipbl deletion is activity-dependent and uncorrelated with changes in gene expression or epigenetic marks
(a) Correlation of cis eigenvector values of 100kb genomic bins before and after Nipbl deletion, split by the functional state of chromatin. Top row, left to right: genome-wide relationship; bins showing constitutive lamin-B1 association across 4 mouse cell types (cLADs); bins showing variable (facultative) lamin-B1 association (fLADs); binds not showing any association (non LADs). Bottom row: bins assigned the Inert ChromHMM simplified state; bins assigned the Repressed state; bins assigned the Active state. (b) Scatter plot of genome-wide ChIP-seq signal binned at 200bp in WT vs ΔNipbl. Top – H3K27ac, bottom – H3K4me3. (c) Stacked heatmap of histone ChIP-seq signal over input +/− 10kb around putative TSS sites sorted by total H3K27ac signal in WT and oriented by TSS strand. From left to right: H3K4me3 in WT and ΔNipbl, followed by H3K27ac in WT and ΔNipbl. (d) ChIP-Seq signal for histone marks of activity vs eigenvector value of 20kb bins, top row – H3K27ac, bottom row – H3K4me3. Left column – WT cells, middle column – ΔNipbl cells, right column – correlation of changes in both signals upon Nipbl deletion. (e) The change in the compartment structure upon Nipbl deletion cannot be attributed to the sign of the local expression change. The heatmap shows the number of 100kb genomic bins as a function of the ranks of expression change and the eigenvector change. The attached plots show the correspondence between the values of expression change (top) or eigenvector change (right) and their ranks.
Extended Data Figure 10
Extended Data Figure 10. Expression changes in ΔNipbl hepatocytes
(a) Changes in gene expression between TAM controls and ΔNipbl liver cells (four replicates for each condition) analyzed with DESeq2 . Genes with significant changes in gene expression (FDR > 0.05) are colored in red (up-regulated, n=487) or blue (down-regulated, n=637), with larger dots corresponding to gene with a fold-change > 3. (b) Intergenic distances for the different categories of disregulated genes (with fold-change >3; up-regulated=268; down-regulated=350; unchanged=15055). Statistical differences determined by an unpaired two-tailed t-test. The differences between means were 50020.40 (CI 95% = 27723.85–72316.95) and 52185 (CI 95%=21824–82547) for comparison between down-regulated vs unchanged, and down-regulated vs up-regulated, respectively (c) Size distribution of the TADs observed in WT (lost in ΔNipbl) depending on the degree alteration of their transcriptional states. The size of TAD with transcriptional changes (red) is significantly larger than those that do not show transcriptional alterations (black) (Kolmogorov-Smirnov, P=4.095e-08) (d) Change in transcription in non-genic intervals (including inter-genic and antisense within gene bodies). Gene expression was calculated as the normalized number of read within intervals defined by merging adjacent 1kb windows showing readcounts over background (see Methods). The numbers of non-coding transcription up-regulated (in red) or down-regulated (in blue) in ΔNipbl compared to the TAM control is given (P-value <0.01 using a two-tailed t-test, four replicates per condition, fold-change higher than 8), with the second number indicating the high-confidence events (labelled with coloured dots, expression value over an arbitrary threshold of 30 reads) which constitute the list used for subsequent analyses. (e) Comparison of control and ΔNipbl H3K27ac normalized signals within predicted liver enhancer elements (n=51850; readcounts within +/− 500bp of predicted enhancer peak) . (f–i) Examples of transcriptional changes upon Nipbl deletion. Stranded RNA-Seq and ChIP-Seq tracks (H3K4me3, H3K27ac) are shown for control (blue) and ΔNipbl (red) samples. Comparison of the chromatin profiles are shown with log2(ΔNipbl/TAM) tracks for H3K4me3 and H3K27ac (in grey). Active enhancers (peaks of high H3K27ac, H3K4me1 , low H3K4me3) are depicted as green ovals. (f) chr10:21,090,000–21,781,000. Bidirectional transcription (position labeled with a blue bar) arises from an isolated enhancer in ΔNipbl cells. (g) chr17:45,945,000–46,176000. Bidirectional transcription (position labeled with a blue bar) arises from two cryptic promoters (H3K4me3 peaks, no/weak transcription in TAM) downstream of Vegfa. (h) chr3:21,712,500–22,126,240. A new transcript from a cryptic promoter 100 kb upstream of Tbl1xr1. H3K27ac signal is enhanced at peaks surrounding the activated cryptic promoter. (i) chr15:9,873,000–10,354,700. Promoter switch for Prlr, from an upstream promoter to a more downstream one surrounded by active enhancers. (j) chr6:141,743,961–141,904,692. Downregulation of Slco1a1 and concomitant up-regulation of Slco1a4 and non-coding intergenic transcripts (arrowheads). Distance of Slco1a4 promoter to intergenic enhancers is less than 10kb, compared to 80 kb for Slco1a1.
Figure 1
Figure 1. Overview of the experimental design
(a) S We deleted a conditional allele of Nipbl (Extended Data Fig. 2) in adult hepatocytes using a liver-specific driver for the CRE-ERT2 fusion protein after injection of Tamoxifen. In absence of Nipbl, cohesin (represented by a triangular ring) is not loaded on chromatin. (b) Expression of Nipbl and Gapdh (control) by RT-qPCR in control (n=4) and ΔNipbl (n=6 for Nipbl; 4 for Gapdh) hepatocytes. Mean normalized gene expression (using Pgk1 as internal control, and WT expression level set as 1) is displayed as mean and s.d and compared using unpaired two-sided t-test (95% CI control=[0.7033–1.297]; mutant=[0.05731–0.2198] for Nipbl expression). (c) Western blots of hepatocyte protein extracts (WCL: whole cell lysate, Nsol (nuclear extract, soluble fraction) Nins (insoluble, chromatin fraction)) showed displacement of cohesin structural subunits (SA-1, SMC1) from the chromatin-bound fraction. H2B and TOP2B distribution serves as controls for loading and enrichment of two nuclear fractions. Experiment repeated on two biologically independent samples per condition. See Supplementary Data 1 for gel data source. (d) Stacked heatmaps of calibrated ChIP-seq signal (for Rad21 and SMC3) at WT Rad21 peaks ranked by fold change over input in the TAM control condition. (e) ChIP-seq tracks for Rad21 and SMC3 over representative genomic regions. (f–g) Hi-C maps at 20kb resolution of WT (left), TAM control (middle) and ΔNipbl cells (right). Top – cis compartment tracks. Middle – cis and trans contact maps of chr16–18. (g) An example of short-range Hi-C map at chr16:25–32Mb with compartment tracks.
Figure 2
Figure 2. Nipbl deletion leads to disappearance of TADs and peaks from Hi-C contact maps
(a) The Hi-C map for chr10:8–21Mb illustrating loss of TADs and peaks. (b) Genome-wide P(s) curves in TAM control and ΔNipbl, normalized to unity at s=10kb. (c, d) The average Hi-C map of (c) 564 TADs of length 300–400kb and (d) 102 peaks of separation 500–600kb. (e) The Hi-C map of an example 2Mb region chr12:57–59Mb (top – TAM control, bottom – ΔNipbl) with expression tracks (middle – annotated genes and RPM normalized RNA-seq; sense above axis, antisense below; TAM in blue, ΔNipbl in red). Black bars show WT TADs. Hi-C and RNA-seq experiments were repeated independently on two and four biological replicates, respectively, with similar results. (f) P(s) curves plotted separately for contacts formed within or between TADs of size 300–500kb. (g) The cartoon representation of the loop extrusion model of cohesin action . In this model, cohesins form cis-loops by first binding to adjacent loci on chromosomes (top and right diagrams). After binding, cohesins translocate along the fiber in both directions, effectively extruding a loop (bottom diagrams). Extrusion halts when cohesins reach boundary elements. Extruded loops disassemble when cohesins unbind from the chromosome (left diagram). (h) Polymer simulations of loop extrusion reproduce the effects of cohesin depletion. Top row – average maps of TADs formed on contact maps in polymer simulations of loop extrusion. Left-to-right: the impact of sequential cohesin depletion on the contact map of a TAD in simulations. Bottom row – P(s) calculated separately within and between TADs.
Figure 3
Figure 3. Nipbl deletion leads to activity-dependent alteration of compartment structure
(a) An example region (chr13:35–60Mb) showing changes in compartmentalization. Top and central panels – 20kb cis compartment tracks. (b) Hi-C maps of an example region at 200kb with predominantly positive (type A) compartment signal in TAM control (top) showing fragmentation upon Nipbl deletion (bottom), manifested in the alternating contact patterns of short- (<10Mb, middle left) and long-range cis (middle right) and trans contact maps (right panel). In (a–b), the two Hi-C replicates of each condition show similar results. (c) The loci experiencing a local drop are depleted in epigenetic marks of activity. Top to bottom: compartment track in TAM (blue) and ΔNipbl (red); simplified ChromHMM state assignments: active (magenta) / repressed (yellow)/inert (cyan); ENCODE activity-related histone ChIP-seq for adult mouse liver cells. In (b–c), arrowheads indicate local drops in compartment signal. (d) Rank correlation of 20kb compartment tracks (n=113,372 20kb genomic bins) in TAM and ΔNipbl, colored by simplified ChromHMM state. Top and right margins – histograms of compartment signal ranks split by simplified ChromHMM state in ΔNipbl (right) and TAM (top). The dashed lines show the tercile borders, splitting bins into equal-sized groups of low (L), middle (M) and high (H) compartment signal. (e) Epigenetic profiles of bins transitioning between compartment signal terciles upon Nibpl deletion. Top to bottom: compartment track in WT and ΔNipbl; ENCODE histone marks; ChromHMM states characteristic of active, repressed and inert chromatin. The bins that transitioned from the middle to the high tercile are enriched in activity marks, while bins transitioning from the high to the middle tercile were depleted in those marks.
Figure 4
Figure 4. Transcriptional changes in Nipbl mutants reveal possible enhancer-promoter miscommunication in absence of TADs
(a) Distribution of fold-changes for genes (black, n=1146)) and exo-genic transcripts (light grey, n=7452) showing at least a two-fold change in expression. (b–c) Examples of transcriptional changes, with TAM control stranded RNA-seq tracks in blue, and ΔNipbl in red. Four replicates per condition, each confirming the reported changes, were combined. (d) Distribution of distances between the transcriptional start of the ncRNAs (up log2(foldchange)>3, n=595; down log2(foldchange)<−3, n=284; unchanged −0.5<log2(foldchange)<0.5, n=2238) and the nearest enhancer. (e,f) Switches in transcription at the Colec12 and Tbl1xr1 loci. Top panels show 40kb Hi-C maps of the 4Mb neighborhood. (e) RNA-seq shows loss of Colec12 transcripts, replaced by antisense transcripts initiated from an intronic enhancer. H3K4me3 and H3K27ac profiles show no changes at distal enhancers (green ovals), while peaks at the Colec12 promoter disappear (red asterisk). (f) Exo-genic transcription emerges in ΔNipbl upstream of the Tbl1xr1 gene on chr3.
Figure 5
Figure 5. Two independent but overlapping modes of chromosomal 3D organization
TADs (colored triangles) and Hi-C peaks disappear upon Nipbl deletion (left), unmasking a stronger and finer compartmentalization (middle) that is visible as a fragmented checkered pattern in the mutant Hi-C map relative to that of the WT and whose alternating member regions more faithfully track transcriptional activity. The resulting reduction of contact range (right) thwarts distant enhancers (ovals) from acting on their normal target genes (arrows, with colored ones indicating active genes, white ones inactive), leading them to act instead on neighboring genes or cryptic promoters located in their vicinity. The active units make up new compartmental regions (grey triangle).

Comment in

References

    1. Bickmore WA, van Steensel B. Genome Architecture: Domain Organization of Interphase Chromosomes. Cell. 2013;152:1270–1284. - PubMed
    1. Dixon JR, Gorkin DU, Ren B. Chromatin Domains: The Unit of Chromosome Organization. Mol Cell. 2016;62:668–680. - PMC - PubMed
    1. Dekker J, Mirny L. The 3D Genome as Moderator of Chromosomal Communication. Cell. 2016;164:1110–1121. - PMC - PubMed
    1. Dekker J, Marti-Renom MA, Mirny LA. Exploring the three-dimensional organization of genomes: interpreting chromatin interaction data. Nat Rev Genet. 2013;14:390–403. - PMC - PubMed
    1. Nora EP, Dekker J, Heard E. Segmental folding of chromosomes: a basis for structural and regulatory chromosomal neighborhoods? Bioessays. 2013;35:818–828. - PMC - PubMed

Publication types