. 2018 Jan 2;12(1):1-12.
doi: 10.1080/19336934.2017.1394558. Epub 2017 Dec 7.

Strong responses of Drosophila melanogaster microbiota to developmental temperature

Affiliations

Strong responses of Drosophila melanogaster microbiota to developmental temperature

Neda N Moghadam et al. Fly (Austin). .

Abstract

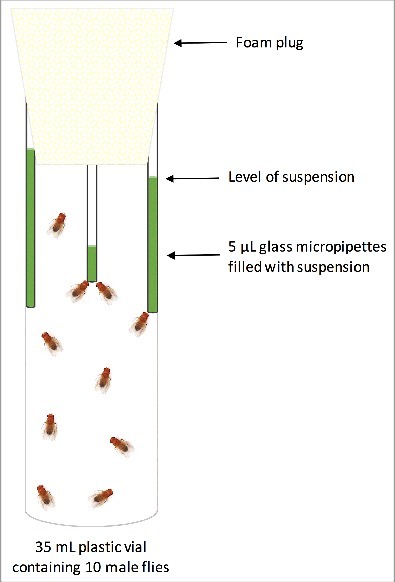
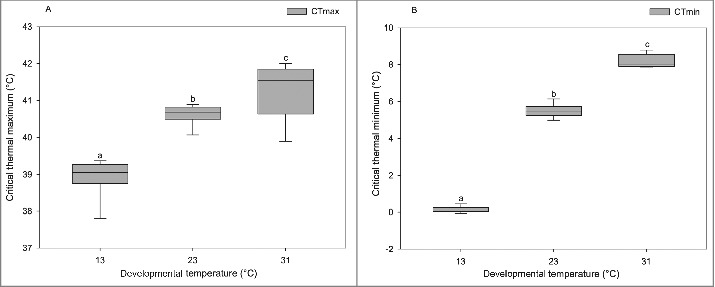
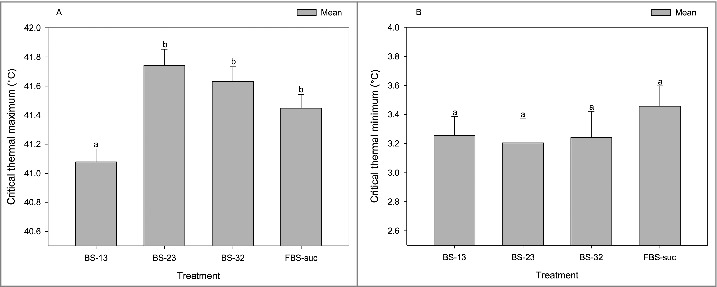
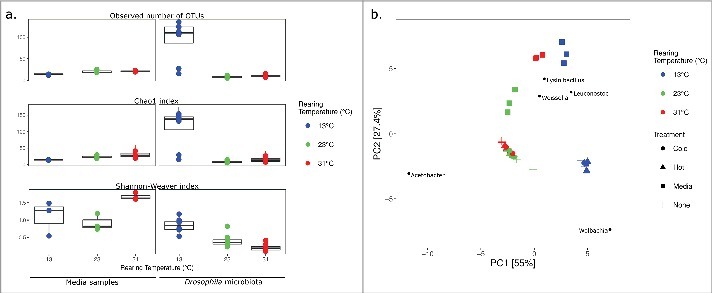
Physiological responses to changes in environmental conditions such as temperature may partly arise from the resident microbial community that integrates a wide range of bio-physiological aspects of the host. In the present study, we assessed the effect of developmental temperature on the thermal tolerance and microbial community of Drosophila melanogaster. We also developed a bacterial transplantation protocol in order to examine the possibility of reshaping the host bacterial composition and assessed its influence on the thermotolerance phenotype. We found that the temperature during development affected thermal tolerance and the microbial composition of male D. melanogaster. Flies that developed at low temperature (13°C) were the most cold resistant and showed the highest abundance of Wolbachia, while flies that developed at high temperature (31°C) were the most heat tolerant and had the highest abundance of Acetobacter. In addition, feeding newly eclosed flies with bacterial suspensions from intestines of flies developed at low temperatures changed the heat tolerance of recipient flies. However, we were not able to link this directly to a change in the host bacterial composition.

Keywords: Drosophila; climate change; developmental temperature; microbiota; thermal tolerance; transplantation.


Figures

Figure 1.
Figure 1.
Illustration of the experimental set-up used to feed the newly eclosed flies with microbial suspensions. Three glass micropipettes filled with suspension of one treatment were placed in a 35 mL plastic vial containing 10 males. The level of suspension in the micropipettes was used to calculate the food intake.
Figure 2.
Figure 2.
Boxplots representing CTmax (A) and CTmin (B) of male D. melanogaster developed at different temperatures, including 13°C (n = 15), 23°C (n = 15) and 31°C (n = 15). Dissimilar letters indicate significant differences between treatment groups. Boxplot graphs show median values, and whiskers extend up to 1.5 * interquartile range (IQR).
Figure 3.
Figure 3.
The barplots representing CTmax (A) and CTmin of male D. melanogaster 24 h post microbial transplantation. Each column shows the mean CTmax or CTmin of each treatment group, including BS-13 (flies that received the suspension containing the gut microbiota of flies developed at 13°C; n = 24), BS-23 (flies that received the suspension containing the gut microbiota of flies developed at 23°C; n = 24), BS-31 (flies that received the suspension containing the gut microbiota of flies developed at 31°C; n = 24), and FBS-suc (flies that received a sucrose suspension without bacteria; n = 24). Error bars indicate the standard error of the mean. Dissimilar letters indicate significant differences between treatment groups.
Figure 4.
Figure 4.
Bacterial within-community (alpha) diversity of the media samples and the microbiome in D. melanogaster developed at three different temperatures were investigated, using observed numbers of OTUs and diversity indices (a). The principal component analysis (PCA) shows the (beta) diversity of the microbiome in male D. melanogaster after rearing at 13°C, 25°C and 31°C (+), and related media samples (▪)(b). Microbiomes deriving from ramping experiments, in which flies reared at these temperatures were exposed to increasing (▴) or decreasing (•) temperatures. The 5 most loaded species are shown on the plot at their highest possible taxonomic classification.

References

    1. Colinet H, Sinclair BJ, Vernon P, Renault D. Insects in fluctuating thermal environments. Annu Rev Entomol. 2015;60(1):123–140. doi: 10.1146/annurev-ento-010814-021017. - DOI - PubMed
    1. Donnelly A, Caffarra A, Kelleher CT, O'Neill BF, Diskin E, Pletsers A, Proctor H, Stirnemann R, O'Halloran J, Penuelas J, et al.. Surviving in a warmer world: environmental and genetic responses. Climate Research. 2012;53:245–262. doi: 10.3354/cr01102. - DOI
    1. Helmuth B, Kingsolver JG, Carrington E. Biophysics, physiological ecology, and climate change: does mechanism matter? Annu Rev Physiol. 2005;67:177–201. doi: 10.1146/annurev.physiol.67.040403.105027. - DOI - PubMed
    1. Pacifici M, Foden WB, Visconti P, Watson JEM, Butchart SHM, Kovacs KM, Scheffers BR, Hole DG, Martin TG, Akçakaya HR, et al.. Assessing species vulnerability to climate change. Nature Climate Change. 2015;5:215–224. doi: 10.1038/nclimate2448. - DOI
    1. Sørensen JG, Kristensen TN, Overgaard J. Evolutionary and ecological patterns of thermal acclimation capacity in Drosophila: is it important for keeping up with climate change? Current Opinion in Insect Science. 2016;17:98–104. doi: 10.1016/j.cois.2016.08.003. - DOI - PubMed

Publication types

MeSH terms