

The potential of microRNAs as human prostate cancer biomarkers: A meta-analysis of related studies
- PMID: 29095529
- PMCID: PMC5814937
- DOI: 10.1002/jcb.26445
The potential of microRNAs as human prostate cancer biomarkers: A meta-analysis of related studies
Abstract
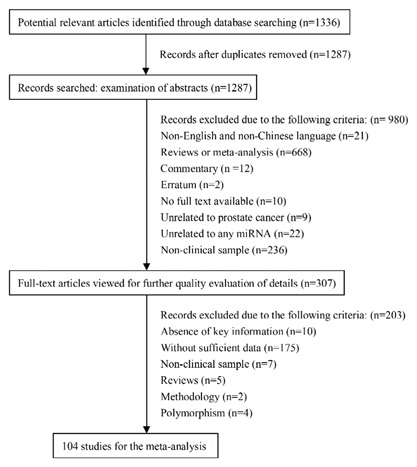
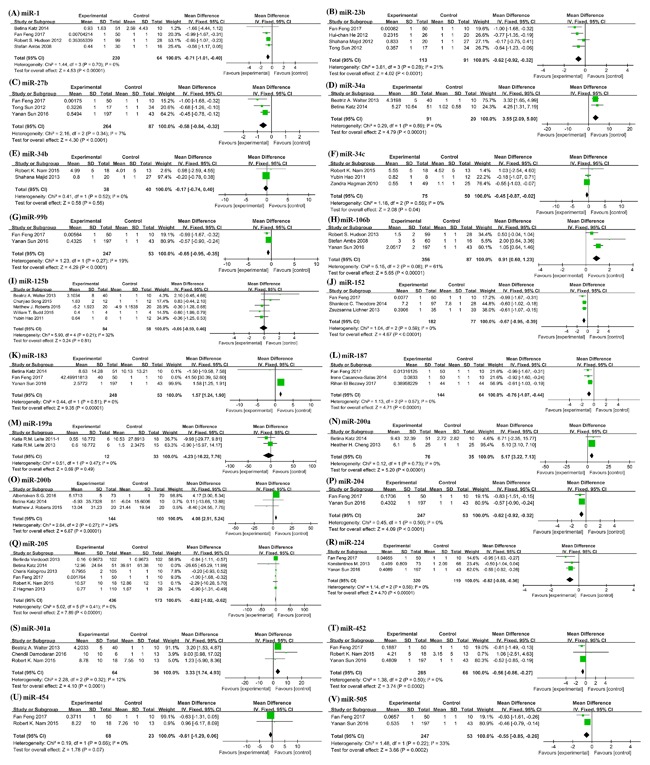
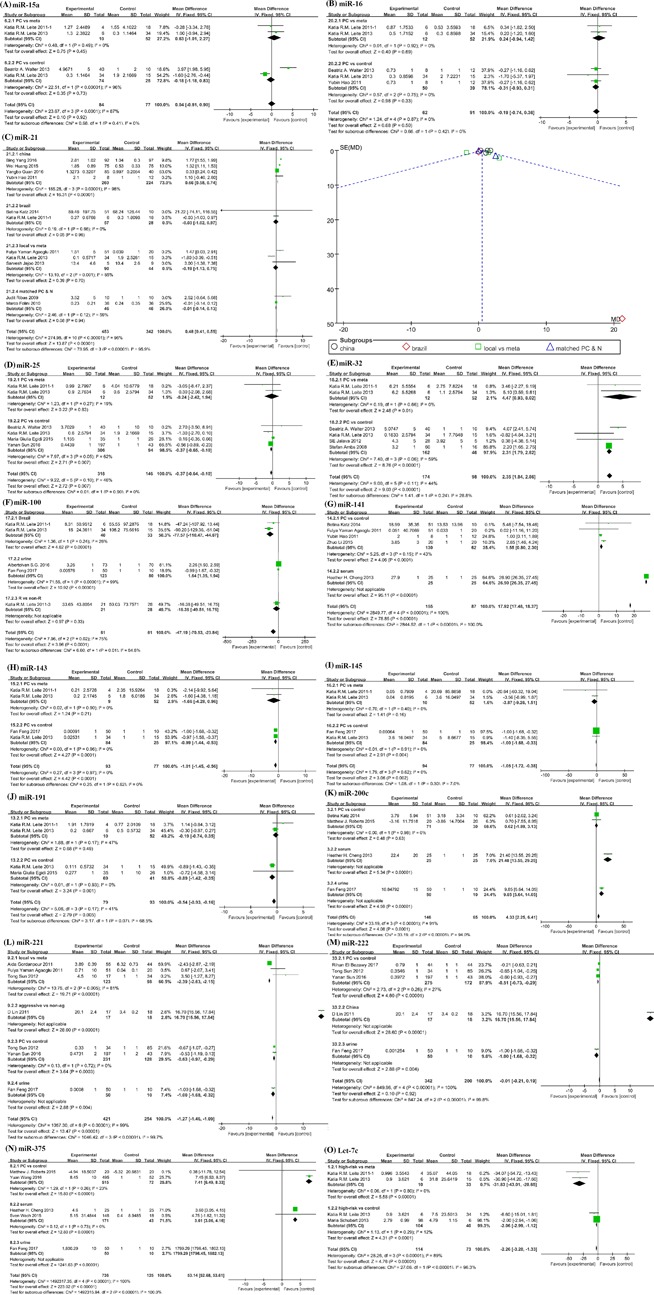
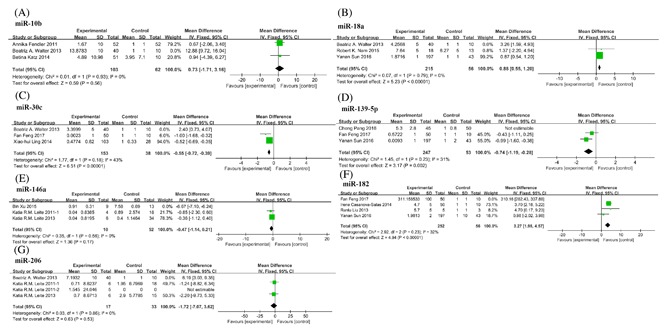
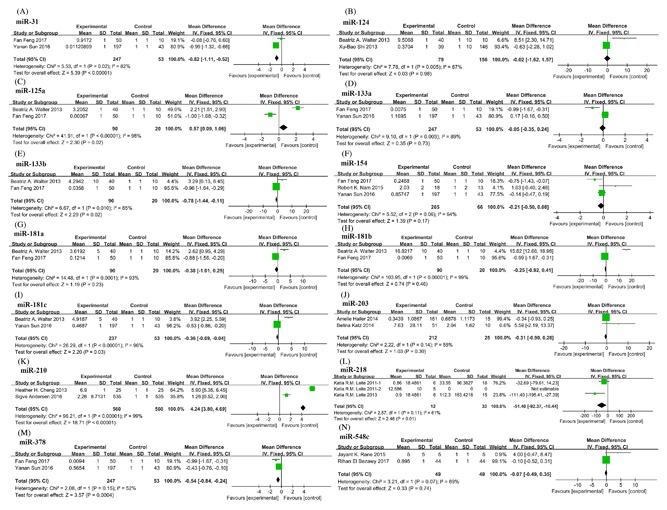
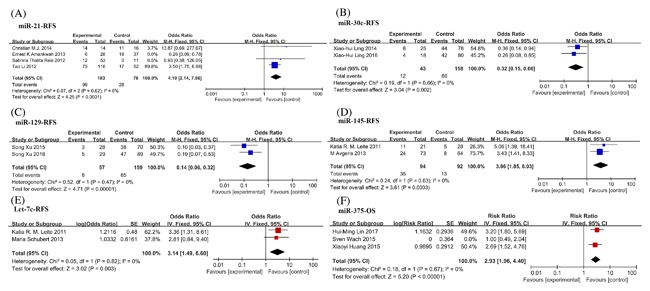
Prostate cancer (PC) is a very important kind of male malignancies. When PC evolves into a stage of hormone resistance or metastasis, the fatality rate is very high. Currently, discoveries and advances in miRNAs as biomarkers have opened the potential for the diagnosis of PC, especially early diagnosis. miRNAs not only can noninvasively or minimally invasively identify PC, but also can provide the data for optimization and personalization of therapy. Moreover, miRNAs have been shown to play an important role to predict prognosis of PC. The purpose of this meta-analysis is to integrate the currently published expression profile data of miRNAs in PC, and evaluate the value of miRNAs as biomarkers for PC. All of relevant records were selected via electronic databases: Pubmed, Embase, Cochrane, and CNKI based on the assessment of title, abstract, and full text. we extracted mean ± SD or fold change of miRNAs expression levels in PC versus BPH or normal controls. Pooled hazard ratios (HRs) with 95% confidence intervals (CI) for overall survival (OS) and recurrence-free survival (RFS), were also calculated to detect the relationship between high miRNAs expression and PC prognosis. Selected 104 articles were published in 2007-2017. According to the inclusion criteria, 104 records were included for this meta-analysis. The pooled or stratified analyze showed 10 up-regulated miRNAs (miR-18a, miR-34a, miR-106b, miR-141, miR-182, miR-183, miR-200a/b, miR-301a, and miR-375) and 14 down-regulated miRNAs (miR-1, miR-23b/27b, miR-30c, miR-99b, miR-139-5p, miR-152, miR-187, miR-204, miR-205, miR-224, miR-452, miR-505, and let-7c) had relatively good diagnostic and predictive potential to discriminate PC from BPH/normal controls. Furthermore, high expression of miR-32 and low expression of let-7c could be used to differentiate metastatic PC from local/primary PC. Additional interesting findings were that the expression profiles of five miRNAs (miR-21, miR-30c, miR-129, miR-145, and let-7c) could predict poor RFS of PC, while the evaluation of miR-375 was associated with worse OS. miRNAs are important regulators in PC progression. Our results indicate that miRNAs are suitable for predicting the different stages of PC. The detection of miRNAs is an effective way to control patient's prognosis and evaluate therapeutic efficacy. However, large-scale detections based on common clinical guidelines are still necessary to further validate our conclusions, due to the bias induced by molecular heterogeneity and differences in study design and detection methods.
Keywords: biomarker; meta-analysis; microRNA; prostate cancer.
© 2017 The Authors. Journal of Cellular Biochemistry Published by Wiley Periodicals, Inc.
Figures
References
-
- Siegel RL, Miller KD, Jemal A. Cancer statistics. CA Cancer J Clin. 2016; 66:7–30. - PubMed
-
- Loberg RD, Logothetis CJ, Keller ET, Pienta KJ. Pathogenesis and treatment of prostate cancer bone metastases: targeting the lethal phenotype. J Clin Oncol. 2005; 23:8232–8241. - PubMed
-
- Dall'Era MA, Cooperberg MR, Chan JM, et al. Active surveillance for early‐stage prostate cancer: review of the current literature. Cancer. 2008; 112:1650–1659. - PubMed
Publication types
MeSH terms
Substances
LinkOut - more resources
Full Text Sources
Other Literature Sources
Medical
