

Obesity Prevalence and Health Consequences: Findings From the Survey of the Health of Wisconsin, 2008-2013
- PMID: 29095585
- PMCID: PMC6230699
Obesity Prevalence and Health Consequences: Findings From the Survey of the Health of Wisconsin, 2008-2013
Abstract
Importance: Although the trends in obesity in Wisconsin overall are well described, less is known about characteristics and health consequences of different degrees of obesity. The Survey of the Health of Wisconsin is a novel population-based health examination survey that provides reliable and valid objective measurements of body mass index.
Objective: Data from the Survey of the Health of Wisconsin is used to characterize the prevalence and consequences of different levels of obesity and track trends over time.
Methods: A total of 3,384 participants age 21-74 years and living in Wisconsin at the time of data collection were surveyed in 2008-2013. Participants completed computer-assisted interviews and physical exams. Predictors and comorbidities of different levels of obesity were measured as prevalence, odds ratios, and population-attributable prevalence.
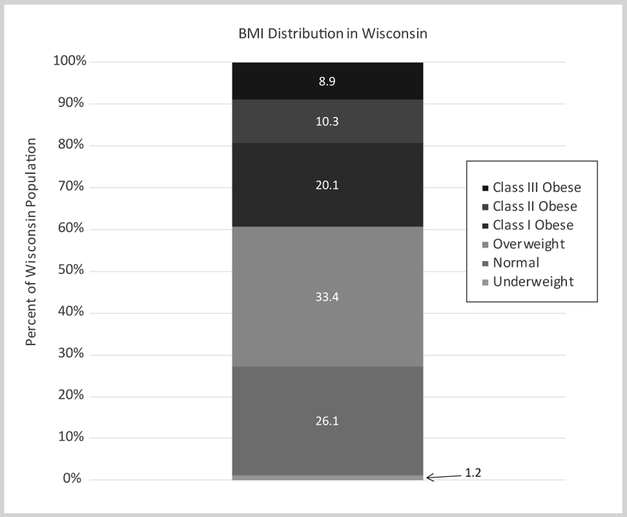
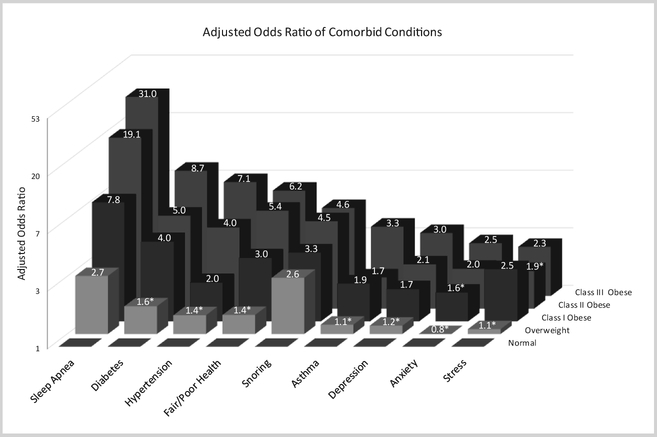
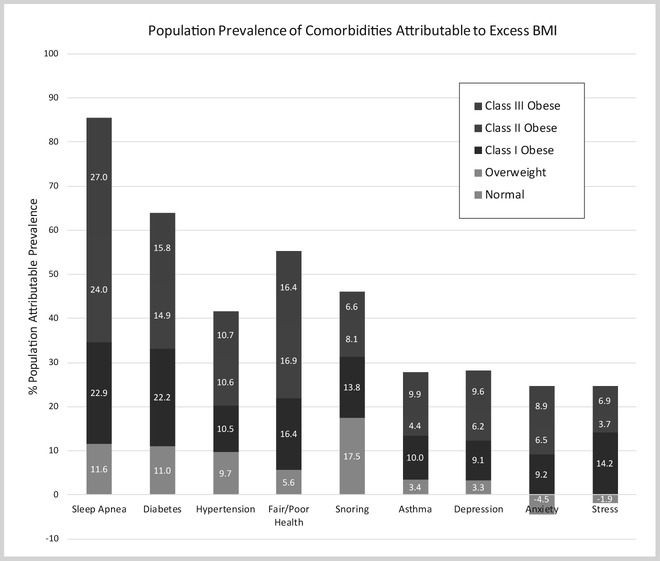
Results: Of Wisconsin adults, 1.2% (CI, 0.7-1.7) are underweight, 26.1% (CI, 23.8-28.4) are normal weight, 33.4% (CI, 31.0-35.7) are overweight, and 39.4% (CI, 35.0-43.7) are obese—with 20.1 % (CI, 18.4-21.9), 10.3% (CI, 9.0-11.7), and 8.9% (CI, 7.6-10.2) in Class I, Class II, and Class III obesity categories, respectively. Obesity rates are higher in people who are older, poor, less educated, minorities, or who live in a community with high economic hardship. There is a dose response relationship between level of obesity and prevalence of all 9 comorbidities that were examined.
Conclusions and relevance: Measured rates of obesity in Wisconsin adults are higher than previously reported for the state, and obesity accounts for a significant proportion of chronic diseases.
Figures
References
Publication types
MeSH terms
Grants and funding
LinkOut - more resources
Full Text Sources
Medical