

Incidence of End-Stage Renal Disease Attributed to Diabetes Among Persons with Diagnosed Diabetes - United States and Puerto Rico, 2000-2014
- PMID: 29095800
- PMCID: PMC5689212
- DOI: 10.15585/mmwr.mm6643a2
Incidence of End-Stage Renal Disease Attributed to Diabetes Among Persons with Diagnosed Diabetes - United States and Puerto Rico, 2000-2014
Abstract
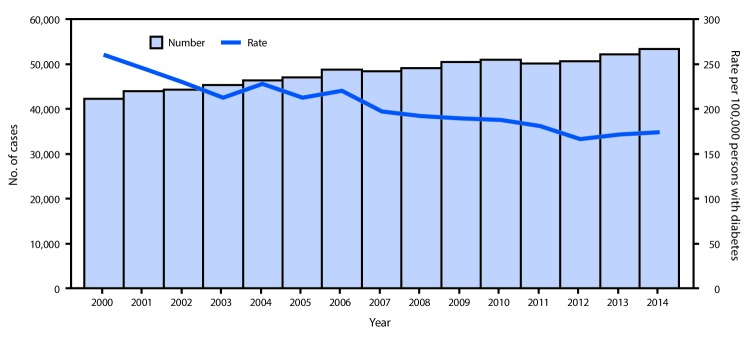
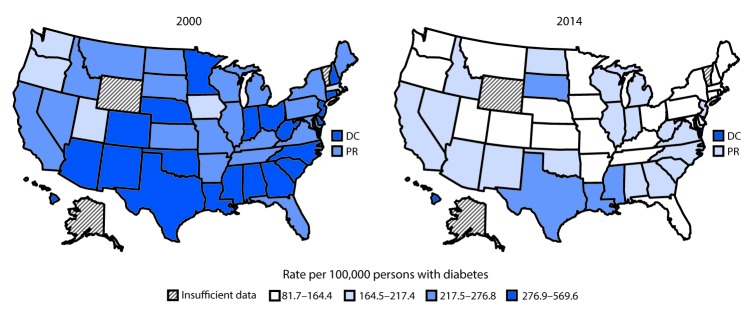
During 2014, 120,000 persons in the United States and Puerto Rico began treatment for end-stage renal disease (ESRD) (i.e., kidney failure requiring dialysis or transplantation) (1). Among these persons, 44% (approximately 53,000 persons) had diabetes listed as the primary cause of ESRD (ESRD-D) (1). Although the number of persons initiating ESRD-D treatment each year has increased since 1980 (1,2), the ESRD-D incidence rate among persons with diagnosed diabetes has declined since the mid-1990s (2,3). To determine whether ESRD-D incidence has continued to decline in the United States overall and in each state, the District of Columbia (DC), and Puerto Rico, CDC analyzed 2000-2014 data from the U.S. Renal Data System and the Behavioral Risk Factor Surveillance System. During that period, the age-standardized ESRD-D incidence among persons with diagnosed diabetes declined from 260.2 to 173.9 per 100,000 diabetic population (33%), and declined significantly in most states, DC, and Puerto Rico. No state experienced an increase in ESRD-D incidence rates. Continued awareness of risk factors for kidney failure and interventions to improve diabetes care might sustain and improve these trends.
Conflict of interest statement
Figures
References
-
- United States Renal Data System (USRDS). 2017 USRDS annual data report: epidemiology of kidney disease in the United States. Bethesda, MD: US Department of Health and Human Services, National Institutes of Health, National Institute of Diabetes and Digestive and Kidney Diseases; 2016. https://www.usrds.org/adr.aspx
-
- CDC. U.S. Diabetes Surveillance System. Atlanta, GA: US Department of Health and Human Services, CDC; 2017. https://gis.cdc.gov/grasp/diabetes/DiabetesAtlas.html
-
- CDC. Surveillance Resource Center: methodologic changes in the Behavioral Risk Factor Surveillance System in 2011 and potential effects on prevalence estimates. Atlanta, GA: US Department of Health and Human Services, CDC; 2013. https://www.cdc.gov/surveillancepractice/reports/brfss/brfss.html
MeSH terms
LinkOut - more resources
Full Text Sources
Other Literature Sources
Medical
