Comparative Study
. 2017 Nov 2;13(11):e1006653.
doi: 10.1371/journal.ppat.1006653. eCollection 2017 Nov.

Comparison of the human gastric microbiota in hypochlorhydric states arising as a result of Helicobacter pylori-induced atrophic gastritis, autoimmune atrophic gastritis and proton pump inhibitor use

Affiliations
Comparative Study

Comparison of the human gastric microbiota in hypochlorhydric states arising as a result of Helicobacter pylori-induced atrophic gastritis, autoimmune atrophic gastritis and proton pump inhibitor use

Bryony N Parsons et al. PLoS Pathog. .

Abstract

Several conditions associated with reduced gastric acid secretion confer an altered risk of developing a gastric malignancy. Helicobacter pylori-induced atrophic gastritis predisposes to gastric adenocarcinoma, autoimmune atrophic gastritis is a precursor of type I gastric neuroendocrine tumours, whereas proton pump inhibitor (PPI) use does not affect stomach cancer risk. We hypothesised that each of these conditions was associated with specific alterations in the gastric microbiota and that this influenced subsequent tumour risk. 95 patients (in groups representing normal stomach, PPI treated, H. pylori gastritis, H. pylori-induced atrophic gastritis and autoimmune atrophic gastritis) were selected from a cohort of 1400. RNA extracted from gastric corpus biopsies was analysed using 16S rRNA sequencing (MiSeq). Samples from normal stomachs and patients treated with PPIs demonstrated similarly high microbial diversity. Patients with autoimmune atrophic gastritis also exhibited relatively high microbial diversity, but with samples dominated by Streptococcus. H. pylori colonisation was associated with decreased microbial diversity and reduced complexity of co-occurrence networks. H. pylori-induced atrophic gastritis resulted in lower bacterial abundances and diversity, whereas autoimmune atrophic gastritis resulted in greater bacterial abundance and equally high diversity compared to normal stomachs. Pathway analysis suggested that glucose-6-phospahte1-dehydrogenase and D-lactate dehydrogenase were over represented in H. pylori-induced atrophic gastritis versus autoimmune atrophic gastritis, and that both these groups showed increases in fumarate reductase. Autoimmune and H. pylori-induced atrophic gastritis were associated with different gastric microbial profiles. PPI treated patients showed relatively few alterations in the gastric microbiota compared to healthy subjects.


Conflict of interest statement

The authors have declared that no competing interests exist.

Figures

Fig 1
Fig 1
(A) Median fasting serum gastrin concentrations (pM) in patient groups. Kruskal-Wallis test with Dunn’s comparison, plotted using Tukey’s method * = P<0.05, and **** = P<0.0001 vs control. (B) Mean number of OTUs identified within each patient group, 1-way ANOVA and Tukey’s multiple comparison test * = P<0.05, ** = P<0.01, Control vs Autoimmune atrophic gastritis P = 0.059, Control vs Neg P = 0.061 and Hp-induced atrophic gastritis vs Neg P = 0.059.
Fig 2
Fig 2. Five different diversity indices of human gastric microbiota (Fisher alpha: parametric index of diversity that models species as logseries distribution; Pielou’s evenness: how close in numbers each species is; Richness: number of species per sample; Shannon: a commonly used index to characterise species diversity; and Simpson: which takes into account the number of species present, as well as their relative abundance).
Pair-wise ANOVA was performed between different groups and if significant (P<0.001), the p-values have been drawn on top. HP atrophy = H. pylori associated atrophy, Auto atrophy = autoimmune atrophic gastritis, Control = normal stomach, HP gastritis = H. pylori associated gastritis, PPI = proton pump inhibitor and negative = extraction control.
Fig 3
Fig 3
Relative abundances of taxa found within (A) groups and (B) individual human gastric biopsies. Hp = H. pylori, IM = intestinal metaplasia, IM+At = intestinal metaplasia and atrophy, PPI = proton pump inhibitor, EC = extraction controls (one of the EC samples was included in a run with more H. pylori dominant samples), H = H2O and M = mock community (which showed consistent findings on two runs as shown). All H. pylori atrophic gastritis samples were positive for H. pylori by serology, + indicates whether these samples were also positive by histology/rapid urease test. Autoimmune atrophic gastritis samples recorded as ‘s’ were also positive for H. pylori by serology.
Fig 4
Fig 4
Nonmetric distance scaling (NMDS) demonstrating clustering of patient groups using (A) unweighted Unifrac distance (pair-wise distance between samples is calculated as a normalised difference in cumulative branch lengths of the observed OTUs for each sample on the phylogenetic tree without taking into account their abundances in samples), (B) Bray-Curtis distance (abundance of OTUs alone and not considering the phylogenetic distance) and (C) weighted Unifrac (unweighted unifrac distance weighted by abundances of OTUs). Serum gastrin concentration indicated by size of each point. Ellipses represent 95% CI of standard error for a given group. Dotted ellipses represent the 95% CI of standard error when H. pylori were removed from the analysis. Atrophy = H. pylori associated atrophic gastritis, Auto = autoimmune atrophic gastritis, Control = normal, HP Gastr = H. pylori associated gastritis and PPI = proton pump inhibitor. PERMANOVA (distances against groups) suggests significant differences (P<0.001 for all three distances) in microbial community explaining the following variations (R2) between groups: 10% (8.6% without H. pylori when using Unweighted Unifrac; 58% (14.5% without H. pylori) when using Weighted Unifrac; and 15% when using Bray-Curtis distance. No significant explanation was observed (P>0.05) for age, BMI, or serum gastrin concentration in the PERMANOVA test. (D) Data from betadisper plots (a mean to compare the spread/variability of samples for different groups) representing difference in distances (Bray-Curtis, Unweighted and weighted Unifrac) of group members from the centre/mean of individual groups after obtaining a reduced-order representation of abundance table using Principle Coordinate Analysis. The pair-wise differences in distances from group centre/mean were then subjected to ANOVA and if significant (P<0.001), the p-values were drawn on top.
Fig 5
Fig 5
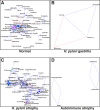
Co-occurrence network analysis between different genera (OTUs collated together at genus level) when considering samples for (A) normal stomach, (B) H. pylori gastritis, (C) H. pylori-induced atrophic gastritis and (D) autoimmune atrophic gastritis. The genera were connected (Blue: positive correlation; Red: negative correlation) when the pair-wise correlation values were significant (P.adj<0.05) after adjusting the P values for multiple comparisons. Furthermore, subcommunity detection was performed by placing the genera in the same subcommunity (represented by colour of nodes) when many links were found at correlation values >0.75 between members of the subcommunity. The size of the nodes represent the degree of connections.

References

    1. Ferlay J, Soerjomataram I, Ervik M, Dikshit R, Eser S, Mathers C, et al. GLOBOCAN 2012 v1.0, Cancer Incidence and Mortality Worldwide: IARC CancerBase No. 11 [Internet]. Lyon, France: International Agency for Research on Cancer; 2013. Available from: http://globocan.iarc.fr/, accessed on 19/07/16.
    1. Uemura N, Okamoto S, Yamamoto S, Matsumura N, Yamaguchi S, Yamakido M, et al. Helicobacter pylori infection and the development of gastric cancer. The New England journal of medicine. 2001;345(11):784–9. Epub 2001/09/15. doi: 10.1056/NEJMoa001999 . - DOI - PubMed
    1. Vannella L, Lahner E, Osborn J, Annibale B. Systematic review: gastric cancer incidence in pernicious anaemia. Aliment Pharmacol Ther. 2013;37(4):375–82. doi: 10.1111/apt.12177 . - DOI - PubMed
    1. Burkitt MD, Pritchard DM. Review article: Pathogenesis and management of gastric carcinoid tumours. Aliment Pharmacol Ther. 2006;24(9):1305–20. Epub 2006/10/25. doi: 10.1111/j.1365-2036.2006.03130.x . - DOI - PubMed
    1. Song H, Zhu J, Lu D. Long-term proton pump inhibitor (PPI) use and the development of gastric pre-malignant lesions. The Cochrane database of systematic reviews. 2014;(12):CD010623 Epub 2014/12/03. doi: 10.1002/14651858.CD010623.pub2 . - DOI - PMC - PubMed

Publication types

MeSH terms

Substances

LinkOut - more resources