. 2017 Nov 2;12(11):e0187568.
doi: 10.1371/journal.pone.0187568. eCollection 2017.

Computer simulation models as a tool to investigate the role of microRNAs in osteoarthritis

Affiliations

Computer simulation models as a tool to investigate the role of microRNAs in osteoarthritis

Carole J Proctor et al. PLoS One. .

Abstract

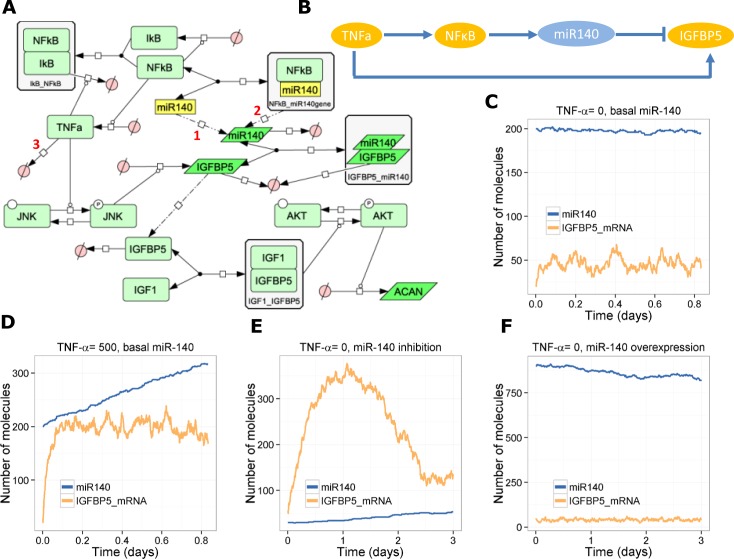
The aim of this study was to show how computational models can be used to increase our understanding of the role of microRNAs in osteoarthritis (OA) using miR-140 as an example. Bioinformatics analysis and experimental results from the literature were used to create and calibrate models of gene regulatory networks in OA involving miR-140 along with key regulators such as NF-κB, SMAD3, and RUNX2. The individual models were created with the modelling standard, Systems Biology Markup Language, and integrated to examine the overall effect of miR-140 on cartilage homeostasis. Down-regulation of miR-140 may have either detrimental or protective effects for cartilage, indicating that the role of miR-140 is complex. Studies of individual networks in isolation may therefore lead to different conclusions. This indicated the need to combine the five chosen individual networks involving miR-140 into an integrated model. This model suggests that the overall effect of miR-140 is to change the response to an IL-1 stimulus from a prolonged increase in matrix degrading enzymes to a pulse-like response so that cartilage degradation is temporary. Our current model can easily be modified and extended as more experimental data become available about the role of miR-140 in OA. In addition, networks of other microRNAs that are important in OA could be incorporated. A fully integrated model could not only aid our understanding of the mechanisms of microRNAs in ageing cartilage but could also provide a useful tool to investigate the effect of potential interventions to prevent cartilage loss.


Conflict of interest statement

Competing Interests: The authors have declared that no competing interests exist.

Figures

Fig 1
Fig 1. Identification and prioritisation of possible OA-associated miRNAs.
Schematic representing the integration of information about (left) validated targets of miRNAs and (right) OA-associated genes. The output is a list of miRNAs sorted by the multiple-test-corrected p-value of their enrichment in OA-associated targets.
Fig 2
Fig 2. Model of the involvement of miR-140 in SMAD3 signalling.
A, Network motif showing positive feedback. B, Diagram of full model. C-D, Output from one stochastic simulation with miR-140 present (miR140 = 500 initially, ksynmiR140 = 0.0018 s-1) (C) or without miR-140 (miR140 = 0 initially, ksynmiR140 = 0.0 s-1) D. Key for B: TGFb_A–active TGF-β, TGFb_I–inactive TGF-β, miR140_SMAD3mRNA–SMAD3 mRNA bound by miR140 to inhibit its translation.
Fig 3
Fig 3. Model of the involvement of miR-140 in SOX9-dependent regulation of RUNX2.
A, Network motif showing incoherent feedforward loop. B, Diagram of full model. C-D, Output from one stochastic simulation, C, with miR-140 (ksynmiR140 = 0.0018 s-1) or D, without miR-140 (ksynmiR140 = 0.0 s-1).
Fig 4
Fig 4. Model of the interaction between miR-140, IL-1 and ADAMTS5.
A, Network motif showing coherent feedforward loop. B, Diagram of full model. C-D, Output from one stochastic simulation, C, with miR-140 (miR140 = 500 initially, ksynmiR140 = 0.0018 s-1) or D, without miR-140 (miR140 = 0 initially, ksynmiR140 = 0.0 s-1).
Fig 5
Fig 5. Model of the interaction between miR-140, IL-1 and MMP13.
A, Network motif showing incoherent feedforward loop. B, Diagram of full model. C-D, Output from one stochastic simulation, C, with miR-140 or D, without miR-140. E-G, output showing simulated interventions: E, NFκB 80% inhibition (kactNFkB = 1e-4 s-1); F, miR-140 50% inhibition (ksynmiR140 = 0.0009 s-1); G, miR-140 overexpression (miR140 = 500 initially, ksynmiR140 = 0.0036 s-1).
Fig 6
Fig 6. Model of the interaction between miR-140, IGFBP-5 and TNF-α.
A, Diagram of full model; B, Network motif showing incoherent feedforward loop. C-F, Output from one stochastic simulation showing total pools of miR-140 and IGFBP5 mRNA, C,TNF-α = 0; D, TNF-α = 500; E, TNF-α = 0, miR-140 inhibition (miR140 = 30 initially, ksynmiR140 = 6e-5 s-1, ksynmiR140NFkB = 1.5e-4 s-1); F, TNF-α = 0, miR-140 overexpression (miR140 = 900 initially, ksynmiR140 s-1 = 0.0018, ksynmiR140NFkB = 0.0045 s-1).
Fig 7
Fig 7. Effect of chronic activation of TNF-α on miR-140, Igfbp5 and Acan.
A-F, Tnfa = 500 initially, kdegTnfa = 1e-5 A, Low levels of miR-140 (miR140 = 30 initially, ksynmiR140 = 6e-5 s-1, ksynmiR140NFkB = 1.5e-4 s-1); B, Basal levels of miR-14-0 (mir140 = 200 initially, ksynmiR140 = 4e-4 s-1, ksynmiR140NFkB = 1e-3 s-1; C, High levels of miR-140 (miR140 = 900 initially, ksynmiR140 = 1.8e-3 s-1, ksynmiR140NFkB = 4.5e-3 s-1); D, Effect of miR-140 on ACAN levels (mean of 100 stochastic simulations; error bars indicate confidence interval of the mean).
Fig 8
Fig 8. Integrated model:: Inhibition of miR-140.
A, Diagram showing main components. Arrows indicate activation, blocked lines indicate inhibition. The red lines show coherent feedforward motif from miR-140/IL1/ADAMTS model; turquoise lines show postive feedback motif from the miR-140/TGF-β/SMAD3 model; green lines show the incoherent feedforward motif from the miR-140/IL1/MMP13 model; lilac lines show the incoherent feedforward motif from the miR-140/SOX9 model; pink lines show the incoherent feedforward motif from the miR-140/IGF-1/TNFα model; dark grey lines indicate additional reactions for the combined model. B-D, Output from the stochastic integrated model after a combined stimulus of IL-1, TNF-α and TGF-β showing levels of ADAMTS-5 and MMP-13 protein, and the amount of Aggrecan and Collagen2 degradation (AggFrag and ColFrag, respectively). B, no inhibition of miR-140 (anti-miR140- = 0). C, moderate inhibition of miR-140 (anti-miR140 = 500); D, high inhibition of miR-140 (anti-miR140 = 3000).
Fig 9
Fig 9. Integrated model: Combined effect of IL-1, TGF-β and miR-140 on cartilage degradation.
Model output showing effect of varying the initial amounts of IL-1 (0–1000, 10 intervals) and TGF-β (1–1000, 3 intervals, log scale) simultaneously on levels of aggrecan fragments (A,C) or collagen2 fragments (B,D). A-B, no miR-140 inhibition (anti-miR140 = 0), C-D, miR-140 inhibition (anti-miR-140 = 500). Curves show mean of 100 stochastic simulations, error bars indicate 95% confidence interval of the mean.
Fig 10
Fig 10. Potential role of miR-200c-3p in osteoarthritis.
Oxidative stress leads to up-regulation of miR-200c-3p. Validated targets of miR-200c-3p that are involved in processes relevant to OA are shown. OA targets from targetvaliation.org are shown in blue rectangles; targets in orange rectangles have strong evidence in miRTarBase and a literature search reveals they are potential targets for OA. ZEB1 inhibits miR-200c-3p to provide a double-negative feedback loop. Red dashed lines indicate inhibition.

References

    1. Martinez NJ, Walhout AJM (2009) The interplay between transcription factors and microRNAs in genome-scale regulatory networks. BioEssays 31: 435–445. doi: 10.1002/bies.200800212 - DOI - PMC - PubMed
    1. Vera J, Lai X, Schmitz U, Wolkenhauer O (2013) MicroRNA-regulated networks: the perfect storm for classical molecular biology, the ideal scenario for systems biology. Adv Exp Med Biol 774: 55–76. doi: 10.1007/978-94-007-5590-1_4 - DOI - PubMed
    1. Alon U (2007) Network motifs: theory and experimental approaches. Nat Rev Genet 8: 450–461. doi: 10.1038/nrg2102 - DOI - PubMed
    1. Geva-Zatorsky N, Rosenfeld N, Itzkovitz S, Milo R, Sigal A, Dekel E, et al. (2006) Oscillations and variability in the p53 system. Molecular Systems Biology 2: 2006.0033. - PMC - PubMed
    1. Proctor C, Gray D (2008) Explaining oscillations and variability in the p53-Mdm2 system. BMC Systems Biology 2: 75 doi: 10.1186/1752-0509-2-75 - DOI - PMC - PubMed

MeSH terms