Comparative Study
. 2018 Jun;79(6):3072-3081.
doi: 10.1002/mrm.26975. Epub 2017 Nov 2.

Comparison of ferumoxytol-based cerebral blood volume estimates using quantitative R1 and R2* relaxometry

Affiliations
Comparative Study

Comparison of ferumoxytol-based cerebral blood volume estimates using quantitative R1 and R2* relaxometry

Leonardo A Rivera-Rivera et al. Magn Reson Med. 2018 Jun.

Abstract

Purpose: Cerebral perfusion is commonly assessed clinically with dynamic susceptibility contrast MRI using a bolus injection of gadolinium-based contrast agents, resulting in semi-quantitative values of cerebral blood volume (CBV). Steady-state imaging with ferumoxytol allows estimation of CBV with the potential for higher precision and accuracy. Prior CBV studies have focused on the signal disrupting T2* effects, but ferumoxytol also has high signal-enhancing T1 relaxivity. The purpose of this study was to investigate and compare CBV estimation using T1 and T2*, with the goal of understanding the contrast mechanisms and quantitative differences.

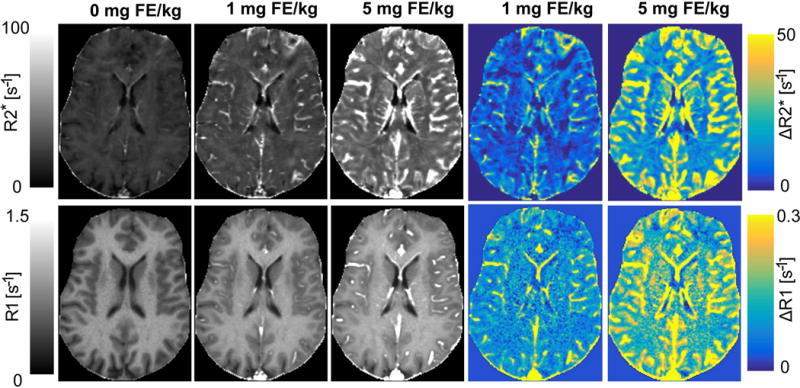
Methods: Changes in R1 (1/T1 ) and R2* (1/ T2*) were measured after the administration of ferumoxytol using high-resolution quantitative approaches. Images were acquired at 3.0T and R1 was estimated from an ultrashort echo time variable flip angle approach, while R2* was estimated from a multiple gradient echo sequence. Twenty healthy volunteers were imaged at two doses. CBV was derived and compared from relaxometry in gray and white matter using different approaches.

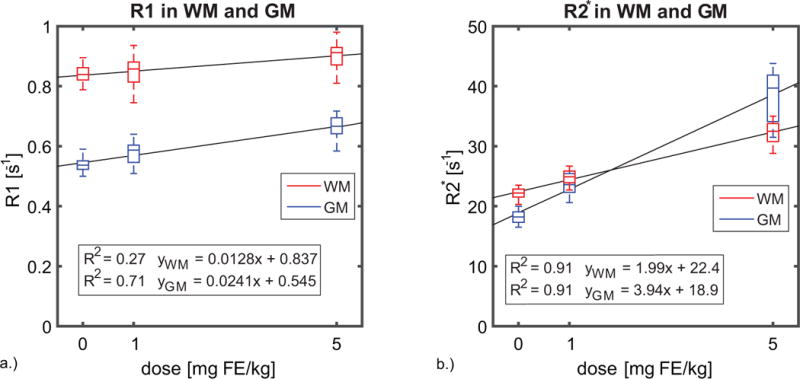
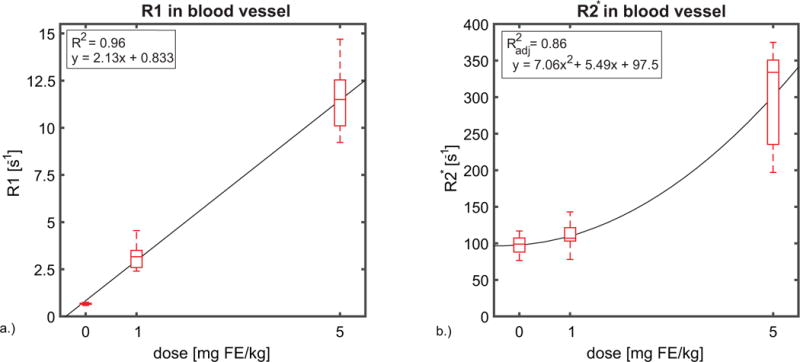
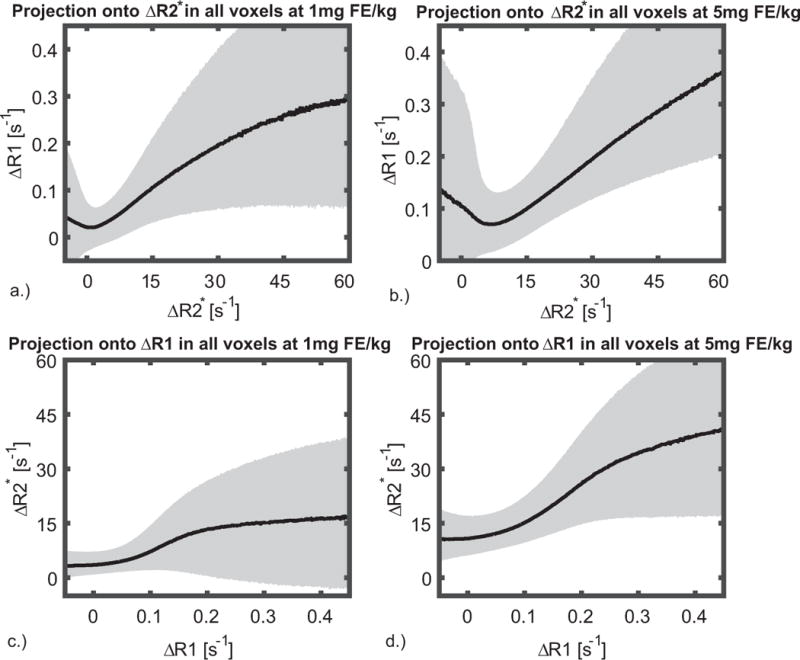
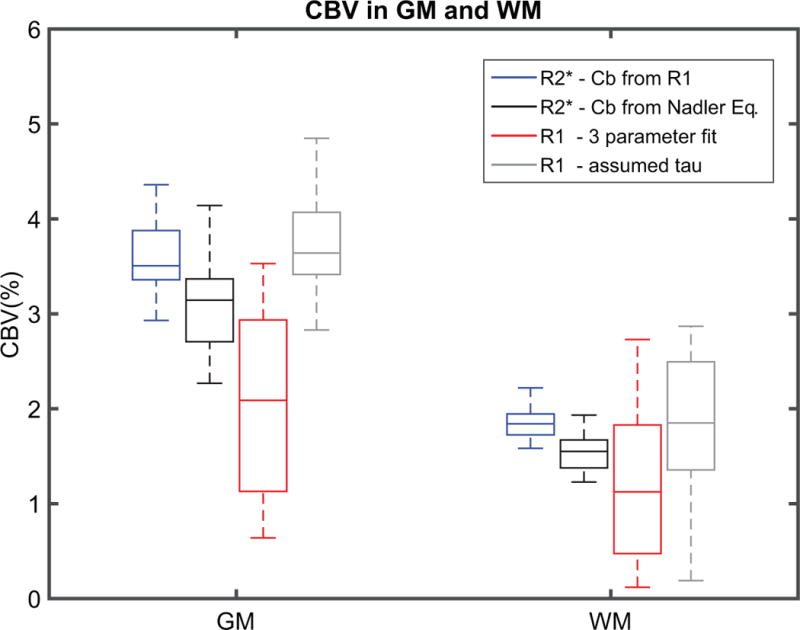
Results: R1 measurements showed a linear dependence of blood R1 with respect to dose in large vessels, in contrast to the nonlinear dose-dependence of blood R2* estimates. In the brain parenchyma, R2* showed linear dose-dependency whereas R1 showed nonlinearity. CBV calculations based on R2* changes in tissue and ferumoxytol blood concentration estimates based on R1 relaxivity showed the lowest variability in our cohort.

Conclusions: CBV measurements were successfully derived using a combined approach of R1 and R2* relaxometry. Magn Reson Med 79:3072-3081, 2018. © 2017 International Society for Magnetic Resonance in Medicine.

Keywords: R2*; R1; cerebral blood volume; ferumoxytol; gray matter; white matter.


Figures

Figure 1
Figure 1
Representative R2*, R1, ΔR2*, and ΔR1 maps from a single slice of the volume from one subject acquired with the UTE-VFA T1 and multi-echo T2* imaging techniques at different doses of ferumoxytol (0 mg FE/kg, 1 mg FE/kg, 5 mg FE/kg). R2* based imaging provides more sensitivity to signal; however, vessels are better depicted in R1 maps. R1 maps also demonstrate lower spatial distortions compared to R2* images. Some regional differences in ΔR1 and ΔR2* are observed, in this case in the frontal lobe gray and white matter, likely arising due to through plane blooming in R2* from vessels in adjacent slices.
Figure 2
Figure 2
Box plots displaying a.) the R1 and b.) R2* changes observed in all subjects (n=20) in gray matter and white matter. The R1 estimates show a weaker correlation with dose-response at high concentrations of ferumoxytol, with a coefficient of determination R2 = 0.27 in WM and 0.71 in GM. While the R2* exhibits a stronger dose response in tissue having a coefficient of determination R2 = 0.91 for both GM and WM.
Figure 3
Figure 3
Box plots showing the a.) R1 and b.) R2* changes observed in ROI’s in a blood vessel (superior sagittal sinus) across all subjects (n=20). In large vessels, R1 in blood exhibits a linear response to dose of ferumoxytol with R2 = 0.96 for the linear fit. While, R2* exhibits a non-linear response to dose, in contrast with a linear relationship between dose and R2* found in tissue. A quadratic model fit the data best with an adjusted coefficient of determination R2adj = 0.86. The superior sagittal sinus was selected to perform blood measurements in order to decrease the variance and possible sources of error. These sources of error include flow induced errors, B1 differences, B0 inhomogeneities and partial volume effects.
Figure 4
Figure 4
Pixel wise relationship between ΔR2* and ΔR1 shown (a, d) for 1mgFE/kg and (b, d) 5mgFE/kg dose of ferumoxytol. The median is shown overlaid on 25–75% quartiles. The pixel wise correlation (a, b) shows a wide range of variation in ΔR1 where ΔR2* does not change. It should be noted that there are fewer voxels with these values, as partially indicated by the wider quartile range. When plotting ΔR2* vs ΔR1, ΔR2* (c, d) tends to exhibit changes where the ΔR1 does not change, suggesting the vessel size is overestimated in R2* images. Similarly, at high ΔR1, ΔR2* is weakly dependent on ΔR1. Many of these voxels are those containing small and medium sized vessels, where the dose response is non-linear and less sensitive to those in the capillary bed. These effects obfuscate the correlation of R2* and R1 outside of the homogenous tissues such as gray and white matter.
Figure 5
Figure 5
Box plots showing different methods for CBV estimates in GM and WM across all subjects (n = 20). The CBV values were higher in both GM and WM when exploiting both: R2* linearity of ferumoxtyol in tissue using a steady state approach and blood R1 to estimate ferumoxytol concentration in blood (from left to right 1st box-blue). Similar but lower CBV estimates were found in GM and WM when using Nadler’s equations to estimate ferumoxytol concentration in blood (2nd box-black). The CBV estimation from fitting 3 parameters into a two-compartment water exchange limited relaxation model were lowest in magnitude and higher in data spread for both GM and WM (3rd box-red). To investigate the spread of the data CBV was estimated from a 2 parameters fit assuming a value of τb= 0.233 ± 0.012 s (4th box-gray). Although the CBV estimates from the 2 parameter fit are forced by the R2* CBV estimates, the reduction in the spread of the data is real, revealing the PS product uncertainties will increase the spread of the CBV estimates.

References

    1. Law M, Yang S, Babb JS, Knopp EA, Golfinos JG, Zagzag D, Johnson G. Comparison of cerebral blood volume and vascular permeability from dynamic susceptibility contrast-enhanced perfusion MR imaging with glioma grade. AJNR Am J Neuroradiol. 2004;25:746–755. - PMC - PubMed
    1. Hachinski V, Iadecola C, Petersen RC, et al. National Institute of Neurological Disorders and Stroke-Canadian Stroke Network vascular cognitive impairment harmonization standards. Stroke. 2006;37:2220–2241. - PubMed
    1. Roher AE. Cardiovascular system participation in Alzheimer’s disease pathogenesis. J Intern Med. 2015;277:426–428. - PubMed
    1. Rivera-Rivera LA, Turski P, Johnson KM, Hoffman C, Berman SE, Kilgas P, Rowley HA, Carlsson CM, Johnson SC, Wieben O. 4D flow MRI for intracranial hemodynamics assessment in Alzheimer’s disease. J Cerebr Blood Flow Metab. 2016 Oct;36(10):1718–1730. - PMC - PubMed
    1. Rivera-Rivera LA, Schubert T, Turski P, Johnson KM, Berman SE, Rowley HA, Carlsson CM, Johnson SC, Wieben O. Changes in intracranial venous blood flow and pulsatility in Alzheimer’s disease: A 4D flow MRI study. J Cereb Blood Flow Metab. 2017 Jun;37(6):2149–2158. - PMC - PubMed

Publication types

MeSH terms

LinkOut - more resources