. 2017 Nov 2;18(1):841.
doi: 10.1186/s12864-017-4229-x.

Optimisation of 16S rRNA gut microbiota profiling of extremely low birth weight infants

Affiliations

Optimisation of 16S rRNA gut microbiota profiling of extremely low birth weight infants

Cristina Alcon-Giner et al. BMC Genomics. .

Abstract

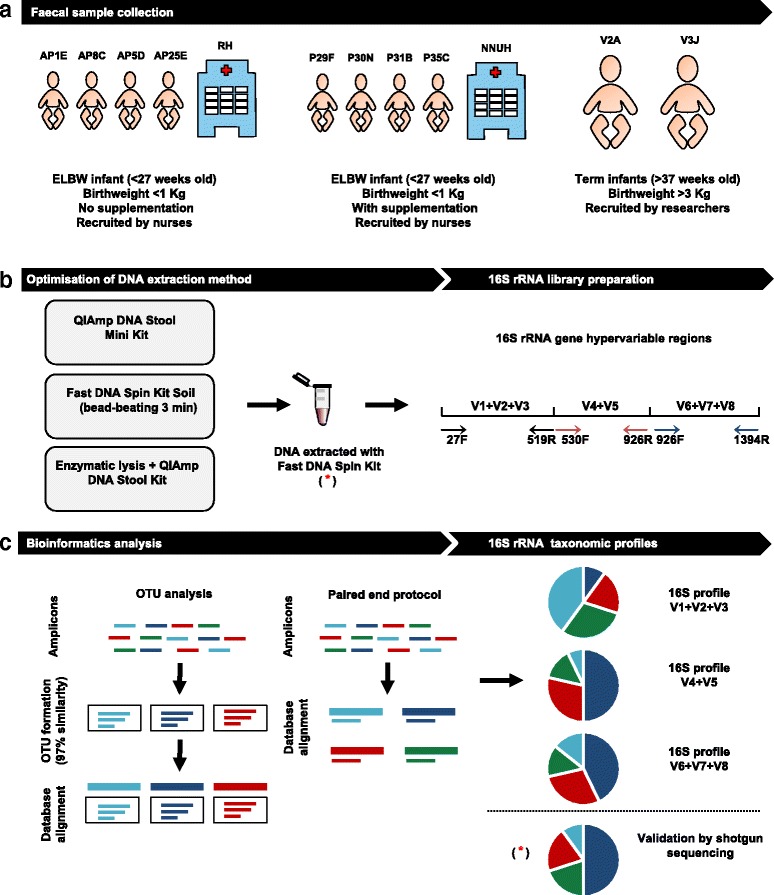
Background: Infants born prematurely, particularly extremely low birth weight infants (ELBW) have altered gut microbial communities. Factors such as maternal health, gut immaturity, delivery mode, and antibiotic treatments are associated with microbiota disturbances, and are linked to an increased risk of certain diseases such as necrotising enterocolitis. Therefore, there is a requirement to optimally characterise microbial profiles in this at-risk cohort, via standardisation of methods, particularly for studying the influence of microbiota therapies (e.g. probiotic supplementation) on community profiles and health outcomes. Profiling of faecal samples using the 16S rRNA gene is a cost-efficient method for large-scale clinical studies to gain insights into the gut microbiota and additionally allows characterisation of cohorts were sample quantities are compromised (e.g. ELBW infants). However, DNA extraction method, and the 16S rRNA region targeted can significantly change bacterial community profiles obtained, and so confound comparisons between studies. Thus, we sought to optimise a 16S rRNA profiling protocol to allow standardisation for studying ELBW infant faecal samples, with or without probiotic supplementation.

Methods: Using ELBW faecal samples, we compared three different DNA extraction methods, and subsequently PCR amplified and sequenced three hypervariable regions of the 16S rRNA gene (V1 + V2 + V3), (V4 + V5) and (V6 + V7 + V8), and compared two bioinformatics approaches to analyse results (OTU and paired end). Paired shotgun metagenomics was used as a 'gold-standard'.

Results: Results indicated a longer bead-beating step was required for optimal bacterial DNA extraction and that sequencing regions (V1 + V2 + V3) and (V6 + V7 + V8) provided the most representative taxonomic profiles, which was confirmed via shotgun analysis. Samples sequenced using the (V4 + V5) region were found to be underrepresented in specific taxa including Bifidobacterium, and had altered diversity profiles. Both bioinformatics 16S rRNA pipelines used in this study (OTU and paired end) presented similar taxonomic profiles at genus level.

Conclusions: We determined that DNA extraction from ELBW faecal samples, particularly those infants receiving probiotic supplementation, should include a prolonged beat-beating step. Furthermore, use of the 16S rRNA (V1 + V2 + V3) and (V6 + V7 + V8) regions provides reliable representation of ELBW microbiota profiles, while inclusion of the (V4 + V5) region may not be appropriate for studies where Bifidobacterium constitutes a resident microbiota member.

Keywords: 16S rRNA gene sequencing; Bifidobacterium; DNA extraction; Extremely low birth weight infants; Microbiota; Shotgun sequencing.


Conflict of interest statement

Ethics approval and consent to participate

Study was approved by the University of East Anglia (UEA) Faculty of Medical and Health Sciences Ethics Committee, and sample collection was in accordance with protocols laid out by the NRES approved UEA Biorepository (Licence no: 11,208). Parents gave written informed consent for their infant to participate in the study.

Consent for publication

Not applicable.

Competing interests

The authors declare that they have no competing interests.

Publisher’s Note

Springer Nature remains neutral with regard to jurisdictional claims in published maps and institutional affiliations.

Figures

Fig. 1
Fig. 1
Study pipeline. a Recruitment of ELBW infants (<1000 g) with no supplementation (AP1E, AP8C, AP5D and AP25D) and ELBW infants with supplementation (P29F, P30N, P31N, P35C) by nurses at the Rosie Hospital (RH) and the NNUH respectively. Term babies (V3 J, V2A) were recruited by researchers. b Optimisation of the bacterial DNA extraction protocol from ELBW infant faeces by testing three different DNA extraction methods (QIAmp DNA Stool Mini Kit, Fast DNA Spin Kit Soil and enzymatic lysis + QIAmp DNA Stool Kit). Bacterial DNA from the study samples was extracted using the Fast DNA Spin Kit Soil and used to prepare three different 16S rRNA gene sequencing libraries. Each library was prepared using a specific pair of primers which target different hypervariable regions (prefixed by a V) of the bacterial 16S rRNA gene: primers 27F-519R target (V1 + V2 + V3), primers 530F-926R target (V4 + V5), and primers 926F-1394R target (V6 + V7 + V8). c A preliminary bioinformatics analysis was performed on two samples using two different bioinformatics pipelines: OTU analysis and the PE protocol. Both bioinformatics approaches were used to compare the different 16S rRNA gene sequencing profiles obtained for the different hypervariable regions tested (V1 + V2 + V3, V4 + V5, and V6 + V7 + V8). (*) Validation of the 16S rRNA sequencing results was performed on three samples (AP8C, P29F and V3 J) by shotgun sequencing
Fig. 2
Fig. 2
Comparison of bioinformatics analyses (OTU versus PE protocol). Preliminary study comparing two different bioinformatics approaches: OTU clustering performed using QIIME and PE protocol. Both bioinformatics approaches used the same database (SILVA version 128). a Taxonomic profiles obtained using PE protocol and OTU clustering for sample AP1E (ELBW infant no supplementation). b Taxonomic profiles obtained using PE protocol and OTU clustering for sample V3 J (term infant sample). Three different 16S rRNA gene libraries were prepared for each sample, V1 + V2 + V3, primers 27F-519R, V4 + V5, primers 530F-926R and V6 + V7 + V8, primers 926F-1394R. Further information on the number of reads obtained for this study can be found in Additional file 8
Fig. 3
Fig. 3
Comparison of taxonomic assignments among the 16S rRNA gene hypervariable regions tested using PE protocol approach. Heat map displaying number of reads assigned to the most common bacterial taxa found in the study samples. Top panel row divides the figure in the different regions of the 16 s rRNA gene analysed, namely: V1 + V2 + V3 (primers 27F-519R), V4 + V5 (primers 530F-926R) and V6 + V7 + V8 (primers 926F-1394R). The vertical axis of the panel indicates a selection of the 13 most common bacterial taxa found. The horizontal axis labels the different samples used in the study: preterms without supplementation (AP1E, AP5D, AP8C, AP25C), preterms with supplementation (P29F, P30N, P31B, P35C), and term baby samples (V2A, V3 J). The intensity of the green colour highlights the abundance of the number of reads found. Probiotic supplementation has been abbreviated to supplem. in the figure. Further information on the number of reads obtained for this study can be found in Additional file 19
Fig. 4
Fig. 4
Principal Coordinate Analysis (PCoA) based on 16S rRNA community profiles analysed using PE protocol of the hypervariable regions tested. PCoA was performed based on the taxonomic assignments obtained from the 16S rRNA gene sequencing libraries analysed. Samples used for this plot were classified in main three groups: preterms without supplementation (AP1E, AP5D, AP8C, AP25C), preterms with supplementation (P29F, P30N, P31B, P35C), and term baby samples (V2A, V3 J). Samples names are coded highlighting the 16S rRNA gene library they belong. Sample names ending in (.27F) belong to 16S rRNA gene library prepared using primers 27F-519R (target region V1 + V2 + V3), sample names ending in (.530F) belong to 16S rRNA gene library prepared using primers 530F-926R (region V4 + V5), and sample names ending in (.926F) belong to 16S rRNA gene library amplified using primers 926F-1394R (region V6 + V7 + V8). PCoA plot indicates that distribution of samples targeting (V4 + V5) region was distinct from samples targeting (V1 + V2 + V3) and (V6 + V7 + V8)
Fig. 5
Fig. 5
Bacterial community profiles determined by shotgun and 16S rRNA gene sequencing data. Comparison of bacterial profiles analysed by shotgun and 16S rRNA gene sequencing data. Normalised data and relative abundance of the bacterial taxa was represented in percentages of number of reads. Bar colours represent different genus taxa, and bar lengths signify the relative abundance of each taxon. 16S rRNA bacterial profiles are named according to the different 16S rRNA hypervariable region amplified: (V1 + V2 + V3, primers 27F-519R), (V4 + V5, primers 530F-926R), and (V6 + V7 + V8, primers 926F-1394R). a Bacterial community profiles determined by shotgun and 16S rRNA gene sequencing from an ELBW infant (sample AP8C) with no supplementation. b Bacterial community profiles determined by shotgun and 16S rRNA gene sequencing from an ELBW infant (sample P29F) with supplementation. c Bacterial community profiles determined by shotgun and 16S rRNA gene sequencing from a term baby (sample V3 J). More detailed information on the number of reads obtained by shotgun and 16S rRNA gene sequencing data can be found in Additional file 20
Fig. 6
Fig. 6
Shotgun taxonomic profiles from two ELBW infants with/without supplementation and a term infant. Radial taxonomic tree displaying shotgun community profiles from faecal samples of an ELBW infant with no supplementation (AP8C, represented in green) an ELBW infant with supplementation (P29F, represented in yellow) and a term baby (V3 J, represented in blue). Relative abundance was indicated according to the length of the coloured bars in the figure. The centre of the radial tree indicates phylum level, and the subsequent concentric layers of the radial tree indicate class, order, family, and genus and species level. Term baby (V3 J) and ELBW infant with supplementation (P29F) samples presented a higher abundance of Bifidobacterium when compared to an ELBW infant with no supplementation (AP8C)

References

    1. WHO. November 2016. http://www.who.int/mediacentre/factsheets/fs363/en/. Accessed 2 Mar 2017.
    1. Melville JM, Moss TJ. The immune consequences of preterm birth. Front Neurosci. 2013;7:79. doi:10.3389/fnins.2013.00079. - PMC - PubMed
    1. Gibson MK, Wang B, Ahmadi S, Burnham C-AD, Tarr PI, Warner BB, et al. Developmental dynamics of the preterm infant gut microbiota and antibiotic resistome. Nature microbiology. 2016;1:16024. doi: 10.1038/nmicrobiol.2016.24. - DOI - PMC - PubMed
    1. Rooks MG, Garrett WS. Gut microbiota, metabolites and host immunity. Nat Rev Immunol. 2016;16(6):341. doi: 10.1038/nri.2016.42. - DOI - PMC - PubMed
    1. Rodríguez JM, Murphy K, Stanton C, Ross RP, Kober OI, Juge N, et al. The composition of the gut microbiota throughout life, with an emphasis on early life. Microb Ecol Health Dis. 2015;26(1):26050. - PMC - PubMed

MeSH terms

Substances