. 2018 Feb;103(2):278-287.
doi: 10.3324/haematol.2017.180430. Epub 2017 Nov 2.

Epstein-Barr virus-associated primary nodal T/NK-cell lymphoma shows a distinct molecular signature and copy number changes

Affiliations

Epstein-Barr virus-associated primary nodal T/NK-cell lymphoma shows a distinct molecular signature and copy number changes

Siok-Bian Ng et al. Haematologica. 2018 Feb.

Abstract

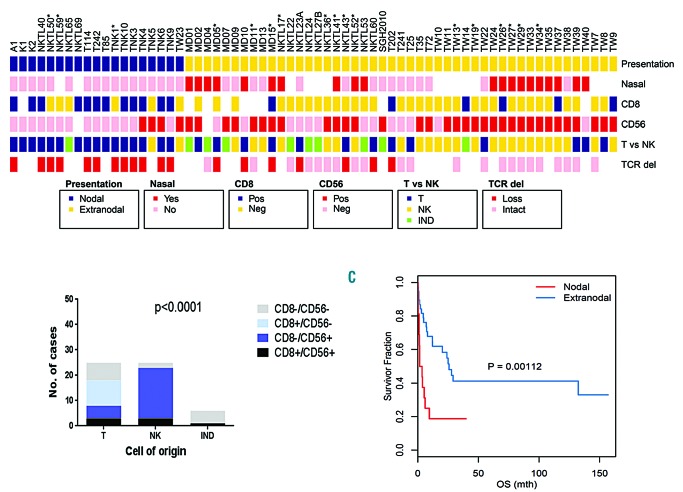
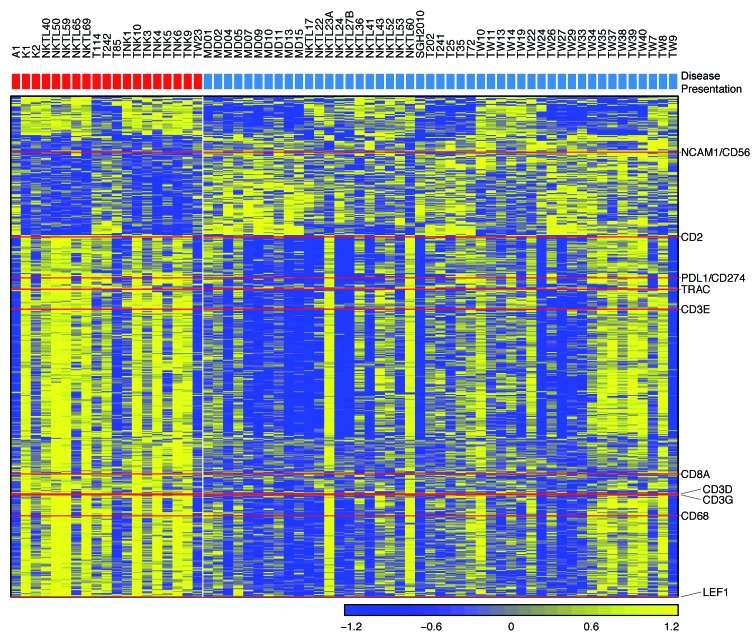
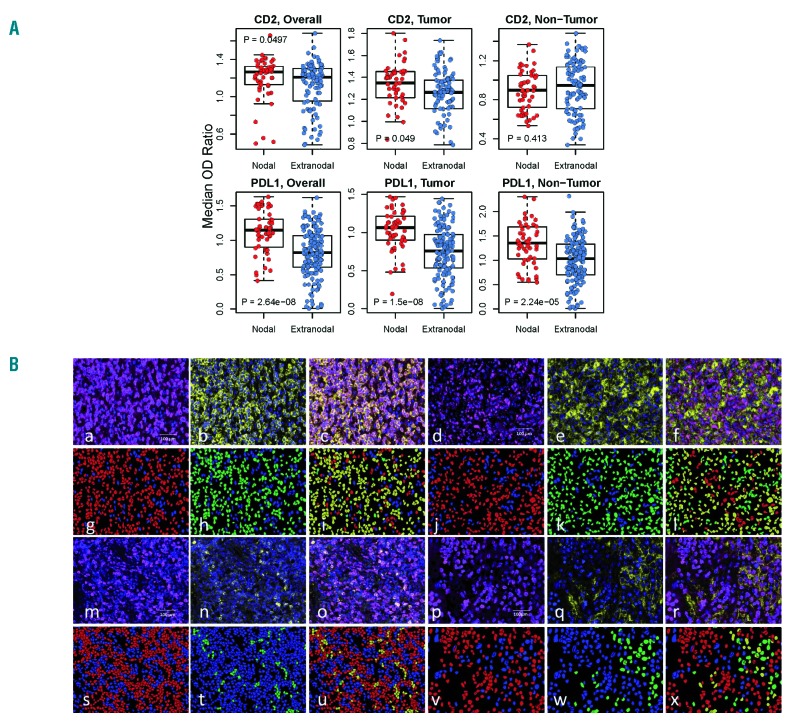
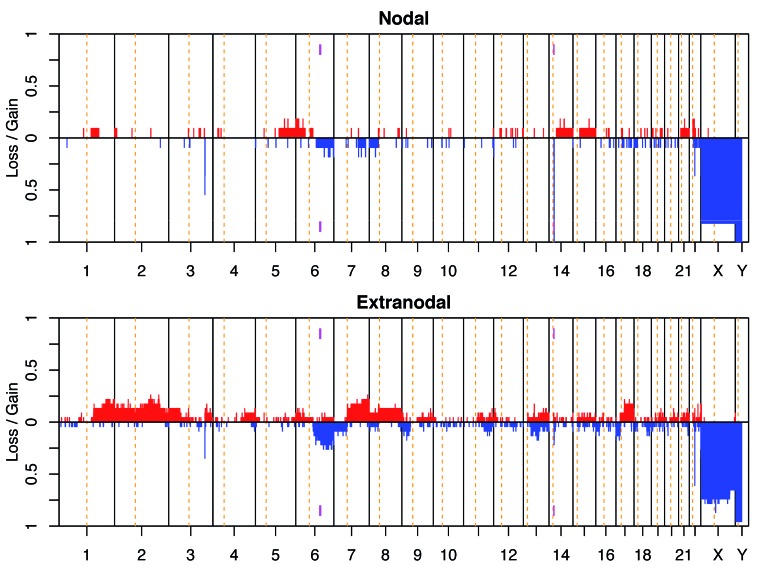
The molecular biology of primary nodal T- and NK-cell lymphoma and its relationship with extranodal NK/T-cell lymphoma, nasal type is poorly understood. In this study, we assessed the relationship between nodal and extranodal Epstein-Barr virus-positive T/NK-cell lymphomas using gene expression profiling and copy number aberration analyses. We performed gene expression profiling and copy number aberration analysis on 66 cases of Epstein-Barr virus-associated T/NK-cell lymphoma from nodal and extranodal sites, and correlated the molecular signatures with clinicopathological features. Three distinct molecular clusters were identified with one enriched for nodal presentation and loss of 14q11.2 (TCRA loci). T/NK-cell lymphomas with a nodal presentation (nodal-group) were significantly associated with older age, lack of nasal involvement, and T-cell lineage compared to those with an extranodal presentation (extranodal-group). On multivariate analysis, nodal presentation was an independent factor associated with short survival. Comparing the molecular signatures of the nodal and extranodal groups it was seen that the former was characterized by upregulation of PD-L1 and T-cell-related genes, including CD2 and CD8, and downregulation of CD56, consistent with the CD8+/CD56-immunophenotype. PD-L1 and CD2 protein expression levels were validated using multiplexed immunofluorescence. Interestingly, nodal group lymphomas were associated with 14q11.2 loss which correlated with loss of TCR loci and T-cell origin. Overall, our results suggest that T/NK-cell lymphoma with nodal presentation is distinct and deserves to be classified separately from T/NK-cell lymphoma with extranodal presentation. Upregulation of PD-L1 indicates that it may be possible to use anti-PD1 immunotherapy in this distinctive entity. In addition, loss of 14q11.2 may be a potentially useful diagnostic marker of T-cell lineage.


Figures

Figure 1.
Figure 1.
Clinicopathological features of the nodal and extranodal groups. (A) Composite map showing clinicopathological features and loss of TCR loci in the N- and EN-groups. The map highlights lack of nasal involvement, CD8+/CD56 phenotype, T-cell lineage and loss of TCR loci in the N-group compared to the EN-group. (B) Graph illustrating the association of CD8/CD56 phenotype with cell lineage. The CD8/CD56+ phenotype is associated with NK-cell lineage while the CD8+/CD56 phenotype is associated with T-cell origin. (C) Survival curve between the N- and EN-groups. Patients in the N-group had significantly shorter overall survival (OS) compared to those in the EN-group.
Figure 2.
Figure 2.
Composite heatmap of gene expression profiling clusters with (top) dendrogram highlighting three clusters in blue, red and green, (upper-middle) disease presentation (nodal in red and extranodal in blue), (lower middle) matrix of the top 500 most highly variable genes, and (bottom) cluster-specific copy number alterations of 66 samples of T/NK-cell lymphoma. Each column represents a case. Genes (rows) in the GEP matrix are ordered based on clustering, but chromosomal segments (rows) in cluster-specific CNA were ordered simply based on their genomic location. Yellow in the GEP matrix indicates upregulation and blue represents downregulation. For the cluster-specific CNA, orange indicates copy number gain and blue represents copy number loss. The GEP heatmap shows three distinct clusters. Cluster 1 (middle, red) shows enrichment for nodal presentation, upregulation of genes and distinctive loss of 14q11.2. Cluster 2 (left, blue) reveals downregulation of genes and loss of 13q14.3-q21.33. Cluster 3 (right, green) shows a mixture of upregulation and downregulation.
Figure 3.
Figure 3.
Heatmap of differentially expressed genes between nodal- and extranodal-groups (fold change > 1.5, P<0.05, false discovery rate < 0.15). Selected genes related to T cells are highlighted. Upregulation and downregulation in the heatmap are marked by yellow and blue, respectively.
Figure 4.
Figure 4.
Protein expression of CD2 and PD-L1 in the nodal and extranodal groups. (A). Plots of CD2 and PD-L1 expression in all cells, tumor and non-tumor cells. Each dot represents the median optical density (OD) ratio of a specific marker in each image analyzed. At least four images containing at least 10,000 cells were quantified per case. The expression of CD2 and PD-L1 across all cell types (both tumor and non-tumor cells) in the cases is illustrated in the left plots indicated ‘Overall’, while that for tumor and non-tumor cells is represented in the middle and right plots, respectively. Our results showed that CD2 expression is significantly upregulated in tumor cells of the N-group compared to the EN-group. Interestingly, PD-L1 expression is significantly higher in both tumor and non-tumor cells in the N-group than in the EN-group. (B). Expression of CD2 and PD-L1 in the N-group and the EN-group cases using multiplexed immunofluorescence (MIF, a-f and m-r) and corresponding multispectral analysis (g-l and s-x). CD3 stained cell membrane of tumor cells (magenta) in single unmixed images (a, d, m, and p). Single CD2 (b and n, cell membrane stain) and PD-L1 (e and q, cell membrane) expression are stained yellow. Images a-l represent a case in the N-group (TNK4) showing high CD2 and PD-L1 expression. CD3+ tumor cells accounted for 82.6% of cells (a and g, positive cells marked magenta and red, respectively) and 67.75% of cells (d and j, positive cells marked magenta and red, respectively). CD2 was present in 81.84% of cells (b and h, positive cells marked yellow and green, respectively). Composite CD3 and CD2 image (c) illustrated 75.9% of double positive cells (I, yellow cells), which represented tumor cells with positive CD2 expression. This case also showed high PD-L1 expression in 87.0% of cells (e and k, positive cells marked yellow and green, respectively). Composite CD3 and PD-L1 image (f) revealed 55.9% of tumor cells showing PD-L1 expression (l, yellow cells). Images m–o, s–u represent a case in the EN-group (TW9) with comparatively low expression of CD2. CD3+ tumor cells accounted for 66.22% of cells (m and s, positive cells marked magenta and red, respectively). Single CD2 expression quantified as 6.75% of cells (n and t, positive cells marked yellow and green, respectively) and the composite image (o) showed 6.51% of CD3+/CD2+ double positive cells (u, double positive cells marked yellow). Images p–r, v–x represent a case in the EN-group (NKTL43) with relatively low expression for PD-L1. CD3+ tumor cells accounted for 67.12% of cells (p and v, positive cells marked magenta and red, respectively). PD-L1 expression is low in 17.53% of cells (q and w, positive cells marked yellow and green, respectively). Composite CD3 and PD-L1 image (r) revealed 5.55% of CD3+/PD-L1+ cells (x, yellow cells).
Figure 5.
Figure 5.
Penetrance plots showing the frequency of gains and losses of genomic regions of cases in the nodal and extranodal groups. Each chromosome is represented on the x-axis, and the y-axis indicates the proportion of gain or loss of the corresponding genomic region within the corresponding population. Gains are shown in red and losses in blue.

References

    1. Attygalle AD, Cabecadas J, Gaulard P, et al. Peripheral T-cell and NK-cell lymphomas and their mimics; taking a step forward -report on the lymphoma workshop of the XVIth meeting of the European Association for Haematopathology and the Society for Hematopathology. Histopathology. 2014;64(2):171–199. - PMC - PubMed
    1. Swerdlow SH, Campo E, Pileri SA, et al. The 2016 revision of the World Health Organization classification of lymphoid neoplasms. Blood. 2016;127(20):2375–2390. - PMC - PubMed
    1. Chan JKC, Quintanilla-Martinez L, Ferry JA, Peh SC. Extranodal NK/T-cell lymphoma, nasal type. In: Swerdlow SH, Campo E, Harris NL, et al., eds. WHO Classification of Tumours of Haematopoietic and Lymphoid Tissues. Lyon: IRAC Press; 2008:285–288.
    1. Ko YH, Chan JKC, Quintanilla-Martinez L. Virally associated T-cell and NK-cell Neoplasms. In: Jaffe ES, Arber DA, Campo E, Harris NL, Quintanilla-Martinez L, eds. Hematopathology. Philadelphia: Elsevier; 2017:565–598.
    1. Kato S, Asano N, Miyata-Takata T, et al. T-cell receptor (TCR) phenotype of nodal Epstein-Barr virus (EBV)-positive cytotoxic T-cell lymphoma (CTL): a clinicopathologic study of 39 cases. Am J Surg Pathol. 2015;39(4):462–471. - PubMed

Publication types