. 2017 Nov 2;7(1):14959.
doi: 10.1038/s41598-017-14971-z.

Marked bias towards spontaneous synaptic inhibition distinguishes non-adapting from adapting layer 5 pyramidal neurons in the barrel cortex

Affiliations

Marked bias towards spontaneous synaptic inhibition distinguishes non-adapting from adapting layer 5 pyramidal neurons in the barrel cortex

Ion R Popescu et al. Sci Rep. .

Erratum in

Abstract

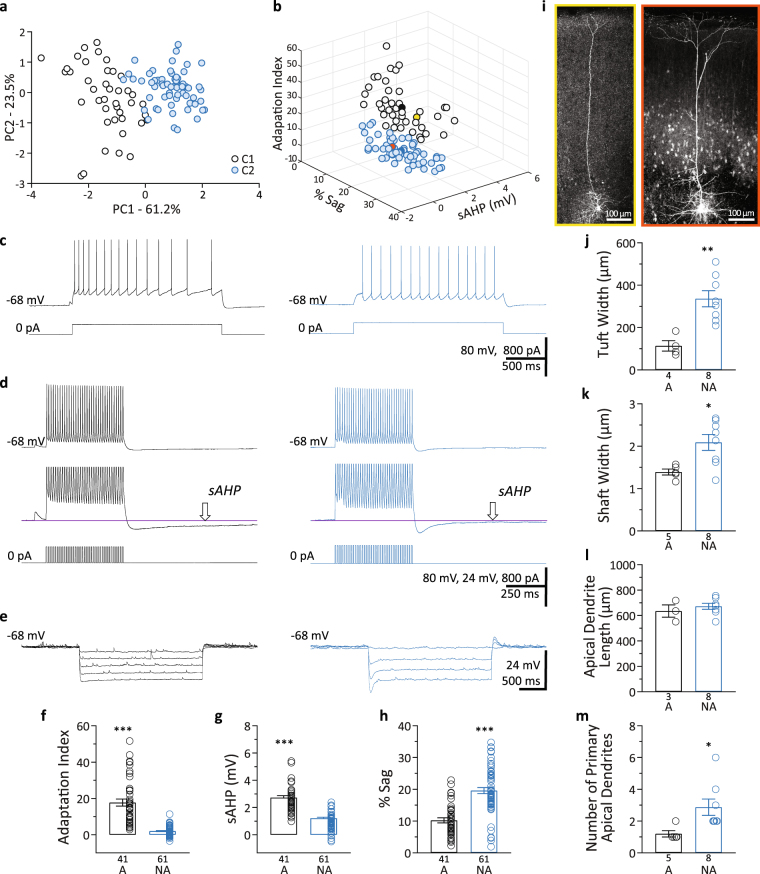
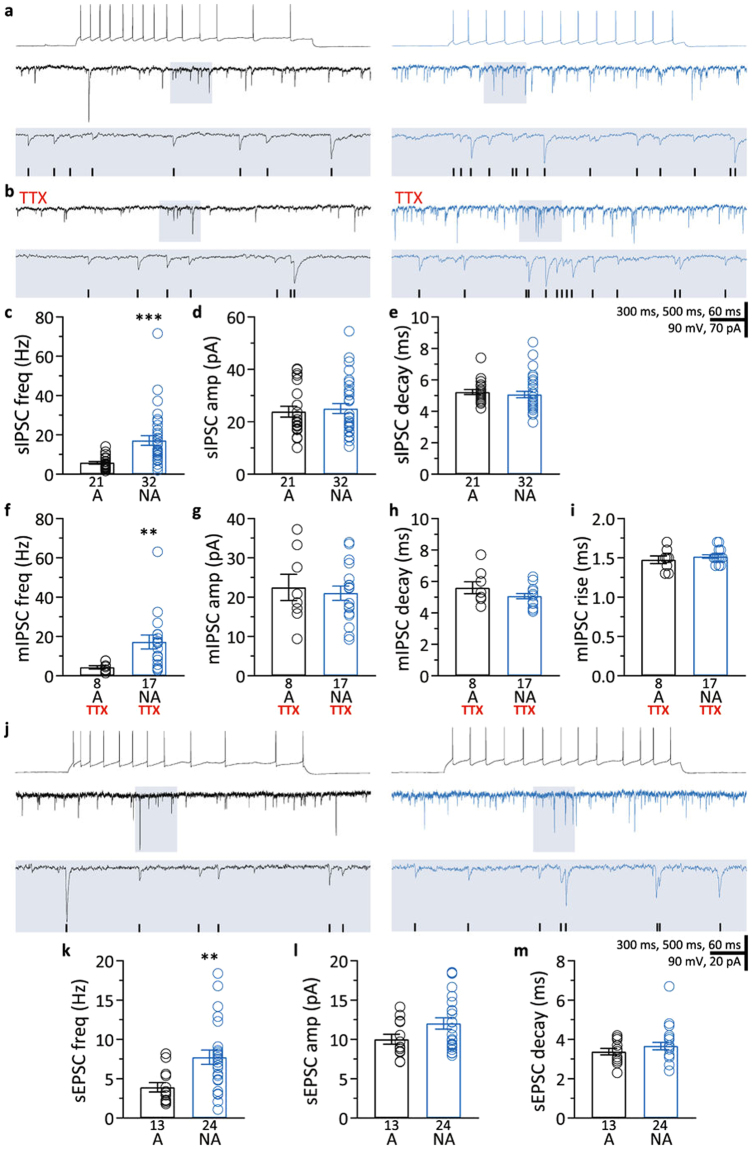
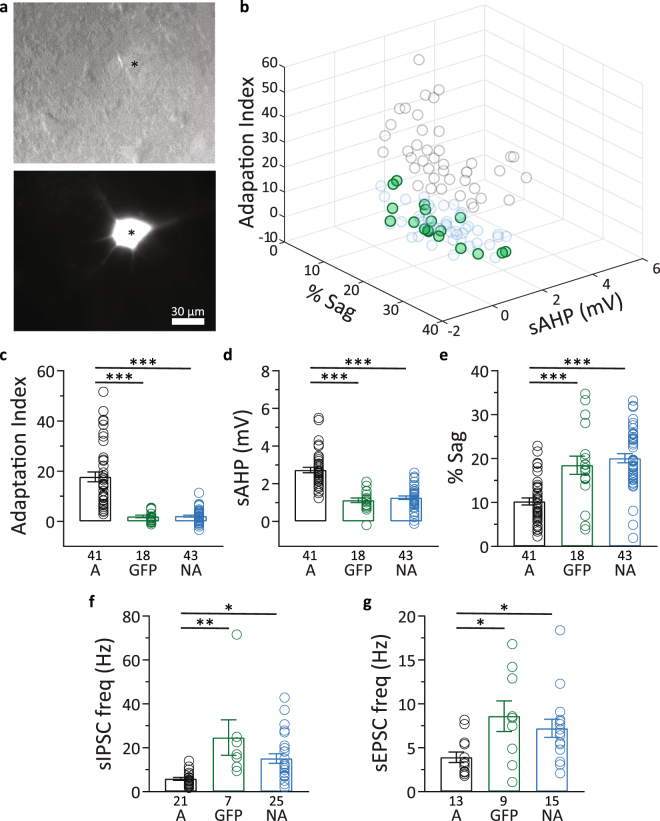
Pyramidal neuron subtypes differ in intrinsic electrophysiology properties and dendritic morphology. However, do different pyramidal neuron subtypes also receive synaptic inputs that are dissimilar in frequency and in excitation/inhibition balance? Unsupervised clustering of three intrinsic parameters that vary by cell subtype - the slow afterhyperpolarization, the sag, and the spike frequency adaptation - split layer 5 barrel cortex pyramidal neurons into two clusters: one of adapting cells and one of non-adapting cells, corresponding to previously described thin- and thick-tufted pyramidal neurons, respectively. Non-adapting neurons presented frequencies of spontaneous inhibitory postsynaptic currents (sIPSCs) and spontaneous excitatory postsynaptic currents (sEPSCs) three- and two-fold higher, respectively, than those of adapting neurons. The IPSC difference between pyramidal subtypes was activity independent. A subset of neurons were thy1-GFP positive, presented characteristics of non-adapting pyramidal neurons, and also had higher IPSC and EPSC frequencies than adapting neurons. The sEPSC/sIPSC frequency ratio was higher in adapting than in non-adapting cells, suggesting a higher excitatory drive in adapting neurons. Therefore, our study on spontaneous synaptic inputs suggests a different extent of synaptic information processing in adapting and non-adapting barrel cortex neurons, and that eventual deficits in inhibition may have differential effects on the excitation/inhibition balance in adapting and non-adapting neurons.


Conflict of interest statement

The authors declare that they have no competing interests.

Figures

Figure 1
Figure 1
Identification of adapting and non-adapting L5 pyramidal neurons. (a) PCA score-plot for the first two principal components for each L5 pyramidal neuron showing the cell clusters detected. Cluster 1 (C1) corresponds to the adapting neurons and C2 corresponds to the non-adapting neurons. (b) 3D scatter plot of the intrinsic properties, adaptation index, % sag, and sAHP, used for the clustering analysis. White circles, adapting neurons; blue circles, non-adapting neurons; solid black and blue circles correspond to the centroids of the two clusters; yellow circle, adapting cell illustrated in panel i-left; orange circle, non-adapting cell illustrated in panel i-right. (c) Examples of action potential trains (upper traces) fired in response to intracellular current injection (lower traces). Left upper trace shows considerable spike frequency adaptation (Adaptation Index = 22.1). Right upper trace shows minimal adaptation (Adaptation Index = 0.5). (d) Upper traces, examples of sAHP from an adapting neuron (left) and a non-adapting neuron (right). Middle traces, Y-axis expansion of upper traces. The amplitude of the sAHP is measured at the arrow. Lower traces, intracellular current injection. (e) Examples of membrane potential sag in response to hyperpolarizing current steps from an adapting (left) and a non-adapting (right) neuron. Larger current steps were used in (e) in the neuron on the right. All representative traces belong to the same adapting (left traces) or non-adapting (right traces) neuron (ce). (f–h) Summary of intrinsic properties for the adapting (A) and non-adapting (NA) groups of L5 pyramidal neurons. (f) Spike frequency adaptation index; (g) sAHP; and (h) %sag. (i–m) Morphological analysis of adapting and non-adapting L5 pyramidal neurons in S1BF. (i) Representative microphotographs of biocytin-labeled neurons. Left/yellow border, adapting neuron; Right/orange border, non-adapting neuron. (j) Tuft width; (k) Shaft width; (l) Length of primary apical dendrites; (m) Number of primary apical dendrites. Data presented as mean ± standard error. *p < 0.05; **p < 0.01; ***p < 0.001.
Figure 2
Figure 2
Characterization of synaptic inputs in adapting and non-adapting L5 pyramidal neurons. (a) Representative recordings illustrating lower sIPSC frequencies in an adapting neuron (left) than in a non-adapting neuron (right). Top traces, action potentials fired in response to intracellular current injection. Each middle trace shows a representative voltage-clamp recording of sIPSCs made from the neuron whose spiking is shown above. Lower traces are expansions of the shaded areas in the middle traces. Detected events are marked with black ticks in the shaded area. (b) Representative recordings showing lower mIPSC frequencies in the adapting neuron (left) than in the non-adapting neuron (right). Recordings are from the same neurons shown in (a). Lower traces are expansions of the shaded areas in the traces above. Black ticks represent detected events. mIPSCs were recorded while action potentials were blocked with 1 µM TTX. (c–e) Summary of sIPSC frequency (c), amplitude (d), and decay time (e) of sIPSCs recorded in adapting (A) and non-adapting (NA) neurons. (f–i) Summary of mIPSC frequency (f), amplitude (g), decay time (h), and rise time (i) of mIPSC recorded in adapting (A) and non-adapting (NA) neurons while action potentials were blocked with TTX. (j) Representative recordings illustrating lower sEPSC frequencies in an adapting neuron (left) than in a non-adapting neuron (right). Top traces, action potentials fired in response to intracellular current injection. Each middle trace shows a representative voltage-clamp recording of sEPSCs made from the neuron whose spiking is shown above. Lower traces are expansions of the shaded areas in the middle traces. Black ticks represent detected events. (k–m) Summary of sEPSC frequency (k), amplitude (l), and decay time (m) of sEPSCs recorded in adapting (A) and non-adapting (NA) neurons. Data presented as mean ± standard error. **p < 0.01; ***p < 0.001.
Figure 3
Figure 3
Intrinsic properties, sIPSCs, and sEPSCs in thy1-GFP+ neurons. (a) Top, representative example of a L5 pyramidal neuron in S1BF under Dodt gradient contrast (*). Bottom, epifluorescence image of the same field of view showing the “*”denoted neuron is GFP+. (b) 3D scatter plot of adapting and non-adapting pyramidal neurons as in Fig. 1b, highlighting the thy-1 GFP+ neurons (green circles) included in the cluster analysis. (c–e) Summary of data showing that GFP+ cells (GFP) and GFP− cells from the non-adapting group (NA) did not differ from each other in adaptation index (c), sAHP (d), and sag (e) but both of these cell groups had different sAHP, sag, and adaptation index compared to adapting L5 pyramidal neurons (A). (f) Summary of data showing that GFP+ cells (GFP) and GFP− cells from the non-adapting group (NA) did not differ in sIPSC frequency, but both had higher sIPSC frequencies compared to adapting L5 pyramidal neurons (A). (g) Summary of data showing that GFP+ cells (GFP) and GFP− cells from the non-adapting group (NA) did not differ in sEPSC frequency, but both had higher sEPSC frequencies compared to adapting L5 pyramidal neurons (A). None of the adapting cells in this study were GFP+. Data presented as mean ± standard error. *p < 0.05; **p < 0.01; ***p < 0.001.

References

    1. Larkman A, Mason A. Correlations between morphology and electrophysiology of pyramidal neurons in slices of rat visual cortex. I. Establishment of cell classes. J Neurosci. 1990;10:1407–1414. - PMC - PubMed
    1. Hattox AM, Nelson SB. Layer V neurons in mouse cortex projecting to different targets have distinct physiological properties. J Neurophysiol. 2007;98:3330–3340. doi: 10.1152/jn.00397.2007. - DOI - PubMed
    1. Dembrow NC, Chitwood RA, Johnston D. Projection-specific neuromodulation of medial prefrontal cortex neurons. J Neurosci. 2010;30:16922–16937. doi: 10.1523/JNEUROSCI.3644-10.2010. - DOI - PMC - PubMed
    1. Oswald MJ, Tantirigama ML, Sonntag I, Hughes SM, Empson RM. Diversity of layer 5 projection neurons in the mouse motor cortex. Front Cell Neurosci. 2013;7:174. doi: 10.3389/fncel.2013.00174. - DOI - PMC - PubMed
    1. Shepherd GM. Corticostriatal connectivity and its role in disease. Nat Rev Neurosci. 2013;14:278–291. doi: 10.1038/nrn3469. - DOI - PMC - PubMed

Publication types

LinkOut - more resources