. 2017 Nov 2;7(1):14946.
doi: 10.1038/s41598-017-14949-x.

3D MALDI Mass Spectrometry Imaging of a Single Cell: Spatial Mapping of Lipids in the Embryonic Development of Zebrafish

Affiliations

3D MALDI Mass Spectrometry Imaging of a Single Cell: Spatial Mapping of Lipids in the Embryonic Development of Zebrafish

Maria Emilia Dueñas et al. Sci Rep. .

Abstract

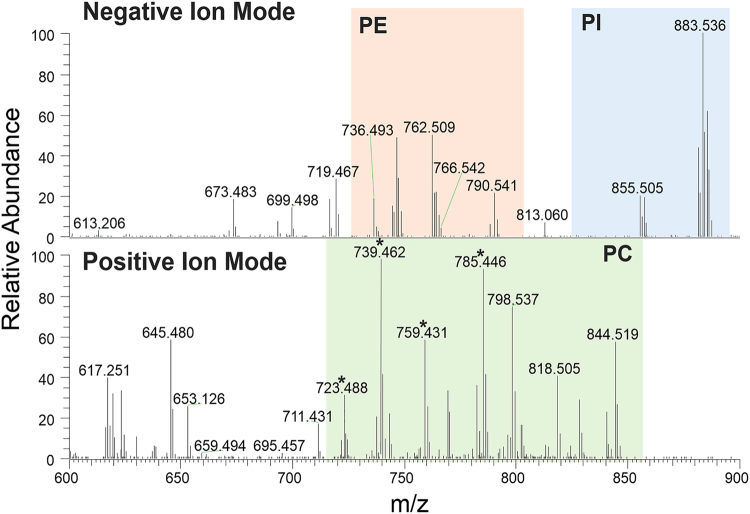
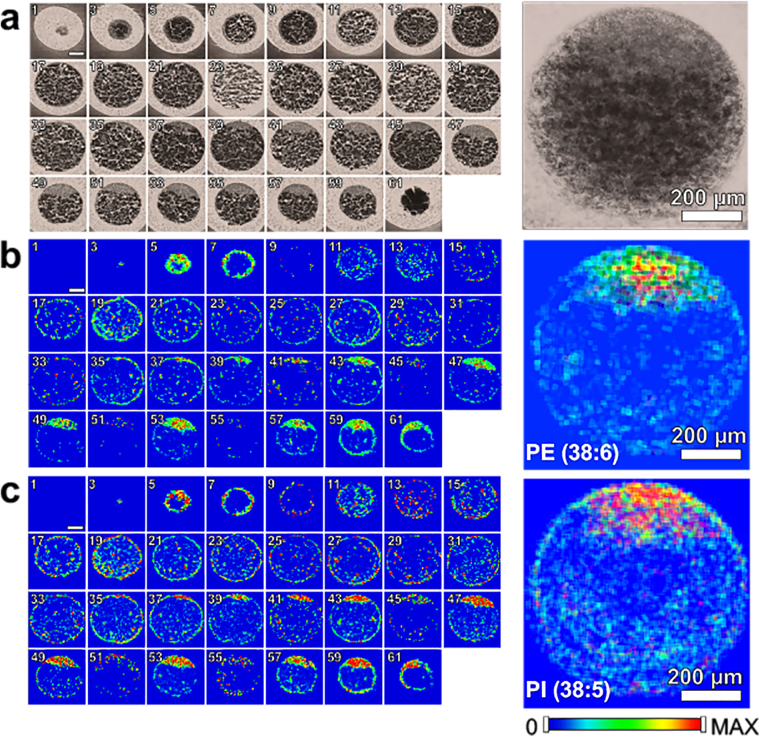
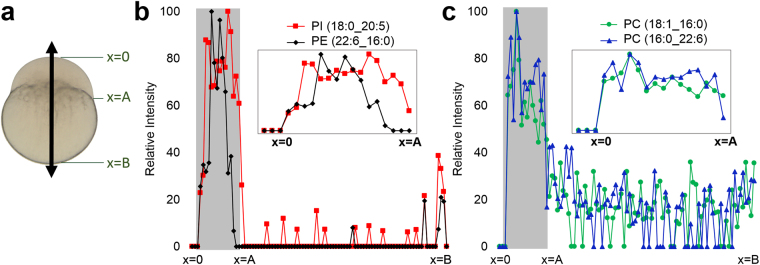
The zebrafish (Danio rerio) has been widely used as a model vertebrate system to study lipid metabolism, the roles of lipids in diseases, and lipid dynamics in embryonic development. Here, we applied high-spatial resolution matrix-assisted laser desorption/ionization (MALDI)-mass spectrometry imaging (MSI) to map and visualize the three-dimensional spatial distribution of phospholipid classes, phosphatidylcholine (PC), phosphatidylethanolamines (PE), and phosphatidylinositol (PI), in newly fertilized individual zebrafish embryos. This is the first time MALDI-MSI has been applied for three dimensional chemical imaging of a single cell. PC molecular species are present inside the yolk in addition to the blastodisc, while PE and PI species are mostly absent in the yolk. Two-dimensional MSI was also studied for embryos at different cell stages (1-, 2-, 4-, 8-, and 16-cell stage) to investigate the localization changes of some lipids at various cell developmental stages. Four different normalization approaches were compared to find reliable relative quantification in 2D- and 3D- MALDI MSI data sets.


Conflict of interest statement

The authors declare that they have no competing interests.

Figures

Figure 1
Figure 1
Representative spectra obtained in negative (top) and positive (bottom) ion mode. Spectral regions that are dominated by a particular phospholipid class are highlighted and labeled with the following class: PC, phosphatidylcholine; PE, phosphatidylethanolamine; and PI, phosphatidylinositol. *corresponds to trimethylamine loss (-N(CH3)3) from the headgroup of PCs.
Figure 2
Figure 2
(a) Odd numbered optical images of fertilized zebrafish embryo at the one-cell stage. False color two-dimensional MALDI-MS images of (b) PE (22:6_16:0) at m/z 762.509 and (c) PI (18:0_20:5) at m/z 883.535. Projected images are shown on the right by overlaying all 2D images. All species were detected as deprotonated, [M-H].
Figure 3
Figure 3
(a) Even numbered optical images of fertilized zebrafish embryo at the 1-cell stage. False color two-dimensional MALDI-MS images of (b) PC (18:1_16:0) at m/z 798.535 and (c) PC (16:0_22:6) at m/z 844.525. Projected images are shown on the right by overlaying all 2D images. All species were detected as potassiated, [M + K]+.
Figure 4
Figure 4
(a) Optical image of fertilized zebrafish embryo showing the arrow to indicate where the line profile is obtained. Line profile of ion intensities for (b) PI (18:0_20:5) and PE (22:6_16:0) and (c) PC (18:1_16:0) and PC (16:0_22:6), obtained from the tissue section 53 and 52, respectively.
Figure 5
Figure 5
Comparison of the four normalization procedures in mol% calculation for the three lipid species of (a) PE, (b) PI, and (c) PC.
Figure 6
Figure 6
MALDI-MS images of selected lipid species in early developmental stages of zebrafish embryos. Peak assignments were based on accurate masses, except those marked by asterisk which were confirmed by MS/MS.

References

    1. McGrail M, et al. Somatic Mutagenesis with a Sleeping Beauty Transposon System Leads to Solid Tumor Formation in Zebrafish. PLoS One. 2011;6:e18826. doi: 10.1371/journal.pone.0018826. - DOI - PMC - PubMed
    1. MacRae CA, Peterson RT. Zebrafish as tools for drug discovery. Nat. Rev. Drug Discov. 2015;14:721–731. doi: 10.1038/nrd4627. - DOI - PubMed
    1. van Amerongen YF, et al. Zebrafish Brain Lipid Characterization and Quantification by 1H Nuclear Magnetic Resonance Spectroscopy and MALDI-TOF Mass Spectrometry. Zebrafish. 2014;11:240–247. doi: 10.1089/zeb.2013.0955. - DOI - PubMed
    1. Veldman MB, Lin S. Zebrafish as a Developmental Model Organism for Pediatric Research. Pediatr. Res. 2008;64:470–476. doi: 10.1203/PDR.0b013e318186e609. - DOI - PubMed
    1. Fraher D, et al. Zebrafish Embryonic Lipidomic Analysis Reveals that the Yolk Cell Is Metabolically Active in Processing Lipid. Cell Reports. 2016;14:1317–1329. doi: 10.1016/j.celrep.2016.01.016. - DOI - PubMed

Publication types

MeSH terms