. 2017 Nov 2;8(1):1270.
doi: 10.1038/s41467-017-01171-6.

Percolation transition of cooperative mutational effects in colorectal tumorigenesis

Affiliations

Percolation transition of cooperative mutational effects in colorectal tumorigenesis

Dongkwan Shin et al. Nat Commun. .

Abstract

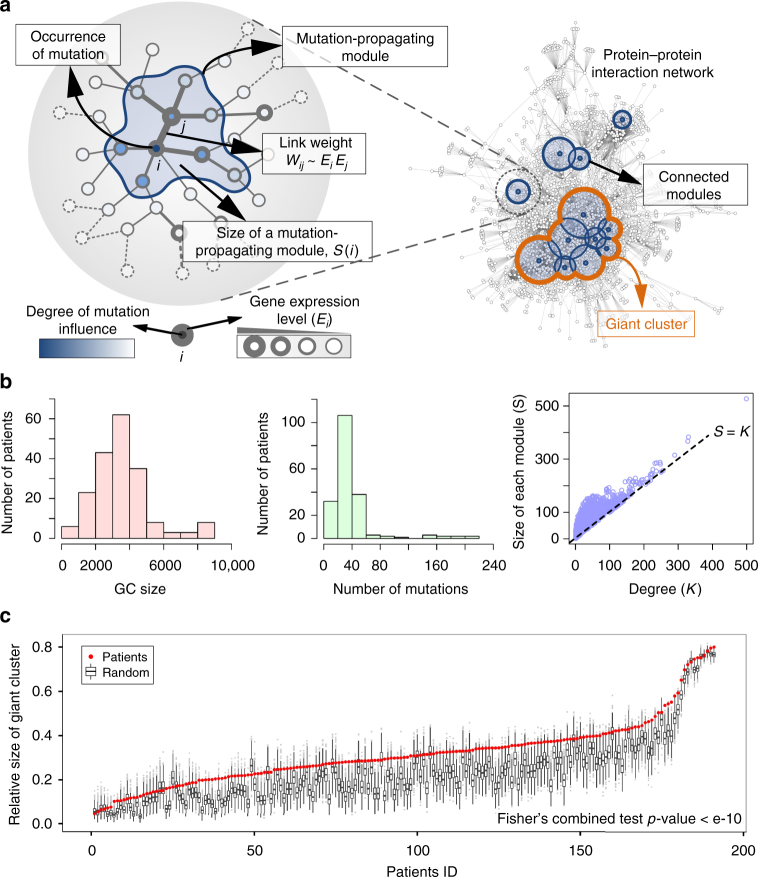
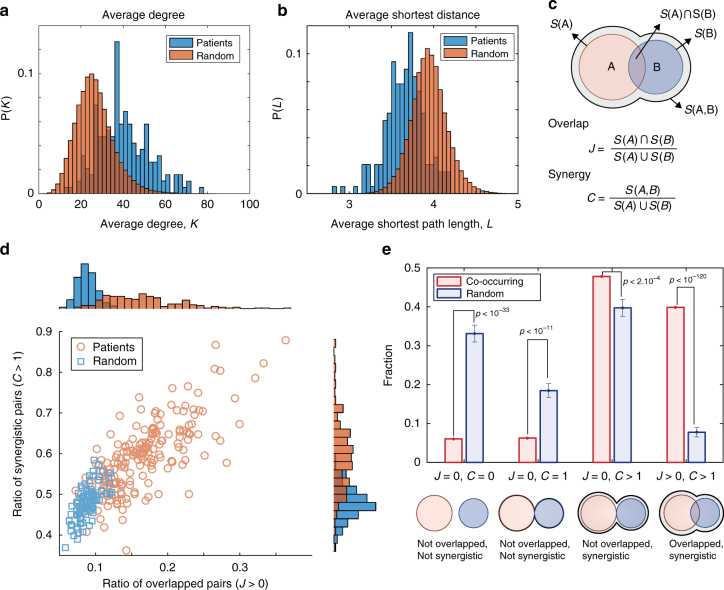
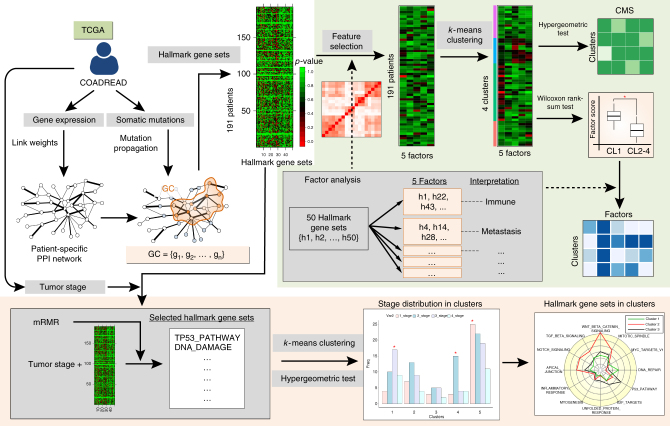
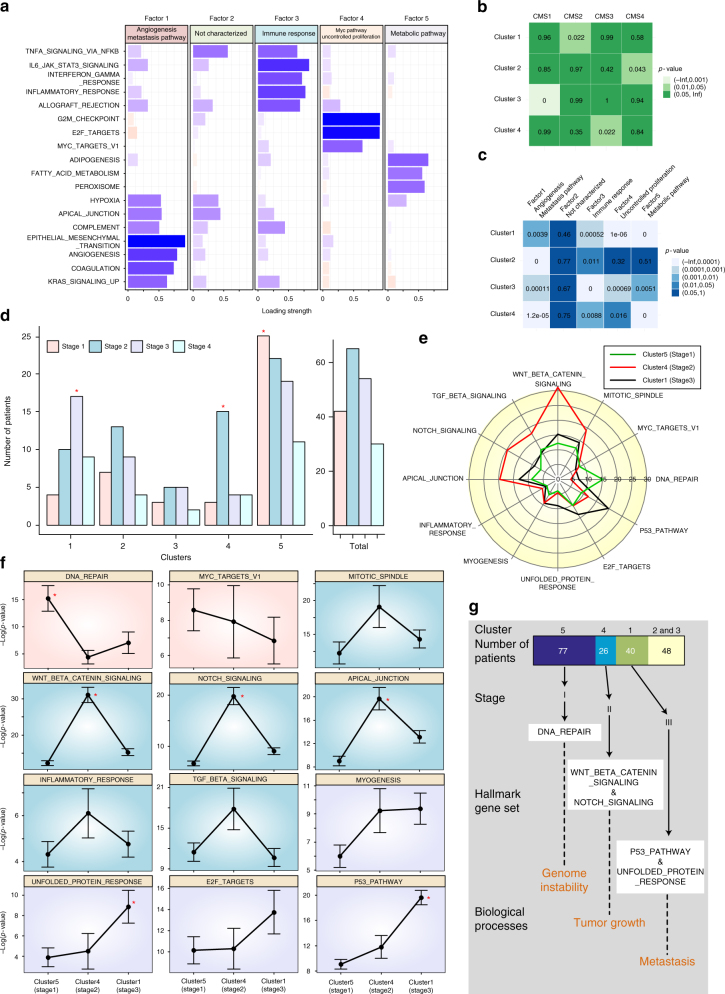
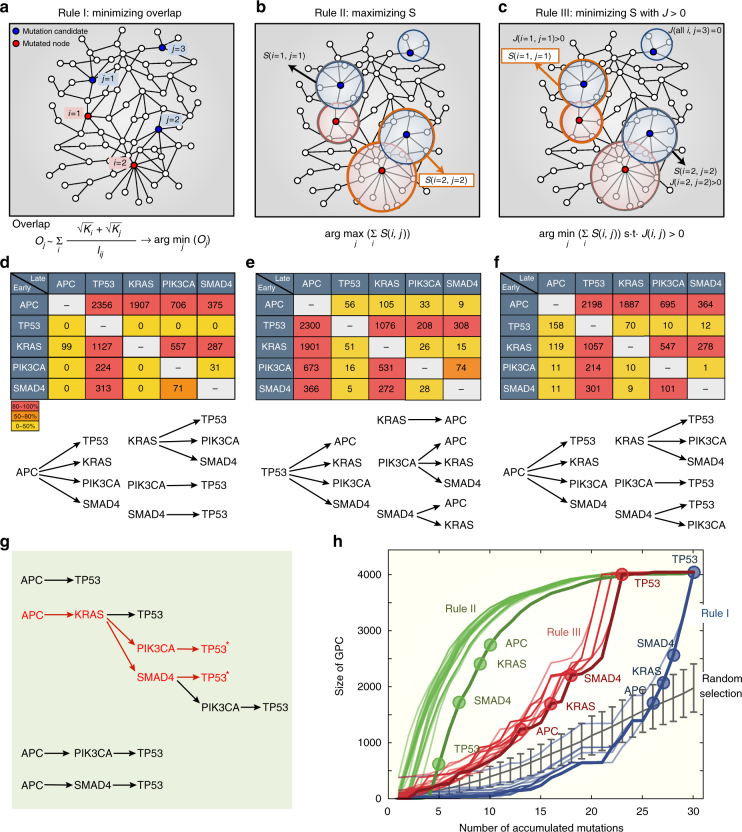
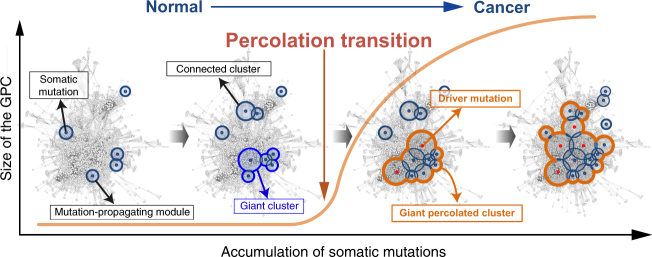
Cancer is caused by the accumulation of multiple genetic mutations, but their cooperative effects are poorly understood. Using a genome-wide analysis of all the somatic mutations in colorectal cancer patients in a large-scale molecular interaction network, here we find that a giant cluster of mutation-propagating modules in the network undergoes a percolation transition, a sudden critical transition from scattered small modules to a large connected cluster, during colorectal tumorigenesis. Such a large cluster ultimately results in a giant percolated cluster, which is accompanied by phenotypic changes corresponding to cancer hallmarks. Moreover, we find that the most commonly observed sequence of driver mutations in colorectal cancer has been optimized to maximize the giant percolated cluster. Our network-level percolation study shows that the cooperative effect rather than any single dominance of multiple somatic mutations is crucial in colorectal tumorigenesis.


Conflict of interest statement

The authors declare no competing financial interests.

Figures

Fig. 1
Fig. 1
The cooperative mutation effects represented by a giant cluster upon a PPI network. a Formation of a giant cluster upon a PPI network by the propagation of mutation influences. A mutation influence propagates along a PPI network and forms a mutation-propagating module, which is a sub-network that is effectively influenced by the mutation. The link weight is determined by the product of the expression levels of its end genes, Wij~EiEj. Several mutation-propagating modules occasionally form connected modules or a giant cluster, which is the largest connected module among them. The color intensity of nodes represents the degree of mutation influence, and the width of a circle indicates the expression level of the corresponding gene. b Distribution of the size of GC (left) and the number of mutations (center) for 191 cancer patients. Right figure shows the size of each mutation-propagating module for all the mutated genes found in patients vs. the degree of each corresponding node for a threshold V = 0.001. c The size of GC normalized the network size for 191 patients compared to the random expectation (n = 1000) where the same number of mutations for each patient was randomly selected
Fig. 2
Fig. 2
Overlap between mutation-propagating modules and their synergistic effects. a Distribution of the average degree of genes that harbor somatic mutations in patients compared to the corresponding random expectation. The average degree of each patient indicates the mean degree of all the mutated genes of that patient, and the random expectation indicates the expected mean when the same number of mutations occurred randomly (n = 1000). b Distribution of the average shortest path length between all the mutations in patients compared to the corresponding random expectation (n = 1000). c The overlap between two mutation-propagating modules, A and B, is measured by the Jaccard index J=S(A)S(B)S(A)S(B). Their synergy is measured by C=S(A,B)S(A)S(B). S(A) denotes the size of the mutation-propagating module when a mutation A occurs, and S(A, B) indicates the size of the connected module when both mutations A and B occur. If A and B are close enough, S(A, B) would be larger than the union of S(A) and S(B). Therefore, there can be some extended area (gray), which indicates additional nodes that are in neither S(A) nor S(B). However, if A and B are far enough apart such that their modules do not overlap, S(A, B) would be 0. The values of J lie in the range [0, 1], with J = 0 for no common genes and J = 1 for identical gene sets between two modules. C > 1 indicates that a connected module is larger than the simple union of the single modules A and B, we call “synergistic”. d Ratio of synergistic pairs (C > 1) vs. ratio of overlapped pairs (J > 0) among all the pairs of somatic mutations for individual patients. For reducing the computational complexity, we considered only a case for randomly selected 100 mutations with 100 iterations. e The fraction of four types of connected modules within 479 co-occurring mutation pairs (see the Methods section for details), compared to the random case with the randomly selected same number of mutation pairs (n = 1000)
Fig. 3
Fig. 3
Hallmark gene set analysis. Flowchart of the hallmark gene set analysis for identifying hallmark gene sets enriched in the GC and for classifying cancer patients based on the selected features using factor analysis and the mRMR feature selection method (see Methods for details)
Fig. 4
Fig. 4
Patient classification and biological interpretation of the patient clusters. a The correlation matrix of the hallmark gene sets was clustered into four global factors with biological characteristics. Each bar indicates the loading strength of a hallmark gene set in each factor. Blue (red) bars represent positive (negative) values, and absolute values were used for the negative values. b The four clusters were classified with statistical clustering (k-means) analysis of the factor scores of the patients. The hypergeometric test was performed to examine the statistical significance of the enrichment of individual CMS groups in each cluster. c Biological interpretation of the clusters with the identified Factors, each of which corresponds to a biological signature of a CMS group. The distribution of the Factor scores of the patients in one cluster was compared to that of the other remaining clusters. p-values were obtained by performing the Wilcoxon rank-sum test. d Distribution of the tumor stages in each cluster. Red asterisks indicate statistical significance (hypergeometric test, p < 0.05). e Comparison of average values of −log (p-value) of each cluster in individual significant hallmark gene sets. f Comparison of the statistical significance (−log (p-value)) of three clusters in each significant hallmark gene set. Red asterisks indicate that there are significant differences in the statistical test results between a group with the highest value and the other two groups (Wilcoxon rank-sum test, p < 0.05). Error bars indicate the standard error. g Summary of the relationships between the hallmark gene sets and the tumor stages in the individual cluster
Fig. 5
Fig. 5
Percolation transition of a GPC. a A mutation selection rule for minimizing the degree of overlap between somatic mutations (see Methods and Supplementary Fig. 16 for details). The rule is to select a mutation candidate j that minimizes the sum of overlap measures between j and all the previously mutated ones. b A mutation selection rule for maximizing the size of connected modules. The rule is to select a mutation candidate j that maximize the sum of S(i, j) for all the previously mutated ones. For instance, node j = 2 will be selected as the next mutation because S(i = 2, j = 2) is larger than S(i = 1, j = 1) in the figure. c A mutation selection rule for minimizing the size of connected modules with the constraint that two modules of j and a mutated one i should overlap, J(i, j) > 0. For instance, node j = 1 will be selected as the next mutation because S(i = 1, j = 1) is smaller than S(i = 2, j = 2) in the figure. By applying the rules to the mutation profiles of individual patients, we obtained totally 3834 mutation sequences according to which mutation was selected as a seed. By investigating the order of a pair of driver mutations in the resulting mutation sequences, we constructed a matrix showing the number of mutation sequences that one driver mutation in a row occurs earlier than the other driver mutation in a column according to the first d, second e, and the last f rules. The bottom figures represent possible orders of driver mutation pairs with significant percentages (80–100%) in the respective rules. g All available mutation sequences from APC to TP53 from the result of f. Red asterisks indicate the most commonly observed sequences of driver mutations in colorectal cancers. h The changes in the size of the GPC along with the accumulation of somatic mutations according to the rules, as an example, for a patient who has four driver mutations, APC, KRAS, SMAD4, and TP53, among 29 somatic mutations (see Methods for details). Driver mutations are denoted by circles at the corresponding order of occurrence of mutations in each rule. For comparison of the rules and the random expectation, we generated 100 mutation sequences among 29 randomly selected genes
Fig. 6
Fig. 6
A schematic of a percolation transition of cooperative mutational effects during tumorigenesis

References

    1. Park S, Lehner B. Cancer type-dependent genetic interactions between cancer driver alterations indicate plasticity of epistasis across cell types. Mol. Syst. Biol. 2015;11:824. doi: 10.15252/msb.20156102. - DOI - PMC - PubMed
    1. Ashworth A, Lord CJ, Reis-Filho JS. Genetic interactions in cancer progression and treatment. Cell. 2011;145:30–38. doi: 10.1016/j.cell.2011.03.020. - DOI - PubMed
    1. Vandin F, Upfal E, Raphael BJ. De novo discovery of mutated driver pathways in cancer. Genome Res. 2012;22:375–385. doi: 10.1101/gr.120477.111. - DOI - PMC - PubMed
    1. Yeang CH, McCormick F, Levine A. Combinatorial patterns of somatic gene mutations in cancer. FASEB J. 2008;22:2605–2622. doi: 10.1096/fj.08-108985. - DOI - PubMed
    1. Davies RJ, Miller R, Coleman N. Colorectal cancer screening: prospects for molecular stool analysis. Nat. Rev. Cancer. 2005;5:199–209. doi: 10.1038/nrc1569. - DOI - PubMed

Publication types