Temporal consistency between gross primary production and solar-induced chlorophyll fluorescence in the ten most populous megacity areas over years
- PMID: 29097731
- PMCID: PMC5668374
- DOI: 10.1038/s41598-017-13783-5
Temporal consistency between gross primary production and solar-induced chlorophyll fluorescence in the ten most populous megacity areas over years
Abstract
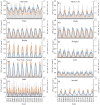
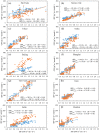
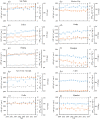
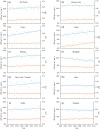
The gross primary production (GPP) of vegetation in urban areas plays an important role in the study of urban ecology. It is difficult however, to accurately estimate GPP in urban areas, mostly due to the complexity of impervious land surfaces, buildings, vegetation, and management. Recently, we used the Vegetation Photosynthesis Model (VPM), climate data, and satellite images to estimate the GPP of terrestrial ecosystems including urban areas. Here, we report VPM-based GPP (GPPvpm) estimates for the world's ten most populous megacities during 2000-2014. The seasonal dynamics of GPPvpm during 2007-2014 in the ten megacities track well that of the solar-induced chlorophyll fluorescence (SIF) data from GOME-2 at 0.5° × 0.5° resolution. Annual GPPvpm during 2000-2014 also shows substantial variation among the ten megacities, and year-to-year trends show increases, no change, and decreases. Urban expansion and vegetation collectively impact GPP variations in these megacities. The results of this study demonstrate the potential of a satellite-based vegetation photosynthesis model for diagnostic studies of GPP and the terrestrial carbon cycle in urban areas.
Conflict of interest statement
The authors declare that they have no competing interests.
Figures


References
-
- Nations, U. (ed Population Division Department of Economic and Social Affairs) (United Nations, New York, NY, USA, 2014).
-
- Northam, R. M. Urban geography. (John Wiley & Sons, 1979).
-
- Churkina G. Modeling the carbon cycle of urban systems. Ecol. Model. 2008;216:107–113. doi: 10.1016/j.ecolmodel.2008.03.006. - DOI
-
- Milesi C, Elvidge CD, Nemani RR, Running SW. Assessing the impact of urban land development on net primary productivity in the southeastern United States. Remote Sens. Environ. 2003;86:401–410. doi: 10.1016/S0034-4257(03)00081-6. - DOI
-
- Trusilova K, Churkina G. The response of the terrestrial biosphere to urbanization: land cover conversion, climate, and urban pollution. Biogeosciences. 2008;5:1505–1515. doi: 10.5194/bg-5-1505-2008. - DOI
Publication types
MeSH terms
Substances
Grants and funding
LinkOut - more resources
Full Text Sources
Other Literature Sources

