. 2017 Nov 2;8(1):1258.
doi: 10.1038/s41467-017-01342-5.

Mammalian γ2 AMPK regulates intrinsic heart rate

Arash Yavari  1   2   3 Mohamed Bellahcene  4   5 Annalisa Bucchi  6   7 Syevda Sirenko  8 Katalin Pinter  4   5 Neil Herring  9 Julia J Jung  10   11 Kirill V Tarasov  8 Emily J Sharpe  12 Markus Wolfien  13 Gabor Czibik  4   5 Violetta Steeples  4   5 Sahar Ghaffari  4   5 Chinh Nguyen  4   5 Alexander Stockenhuber  4   5 Joshua R St Clair  12 Christian Rimmbach  10   11 Yosuke Okamoto  8 Dongmei Yang  8 Mingyi Wang  8 Bruce D Ziman  8 Jack M Moen  8 Daniel R Riordon  8 Christopher Ramirez  8 Manuel Paina  6   7 Joonho Lee  8 Jing Zhang  8 Ismayil Ahmet  8 Michael G Matt  8 Yelena S Tarasova  8 Dilair Baban  5 Natasha Sahgal  5 Helen Lockstone  5 Rathi Puliyadi  4   5 Joseph de Bono  4   5 Owen M Siggs  5   14 John Gomes  15 Hannah Muskett  4   5 Mahon L Maguire  4   5 Youlia Beglov  4   5 Matthew Kelly  4   5 Pedro P N Dos Santos  16 Nicola J Bright  17 Angela Woods  17 Katja Gehmlich  4   5 Henrik Isackson  4 Gillian Douglas  4   5 David J P Ferguson  18 Jürgen E Schneider  4   5 Andrew Tinker  15   19 Olaf Wolkenhauer  13   20 Keith M Channon  4   5 Richard J Cornall  5   14 Eduardo B Sternick  16 David J Paterson  9 Charles S Redwood  4 David Carling  17 Catherine Proenza  12 Robert David  10   11 Mirko Baruscotti  6   7 Dario DiFrancesco  6   7 Edward G Lakatta  8 Hugh Watkins  4   5 Houman Ashrafian  21   22   23
Affiliations

Mammalian γ2 AMPK regulates intrinsic heart rate

Arash Yavari et al. Nat Commun. .

Abstract

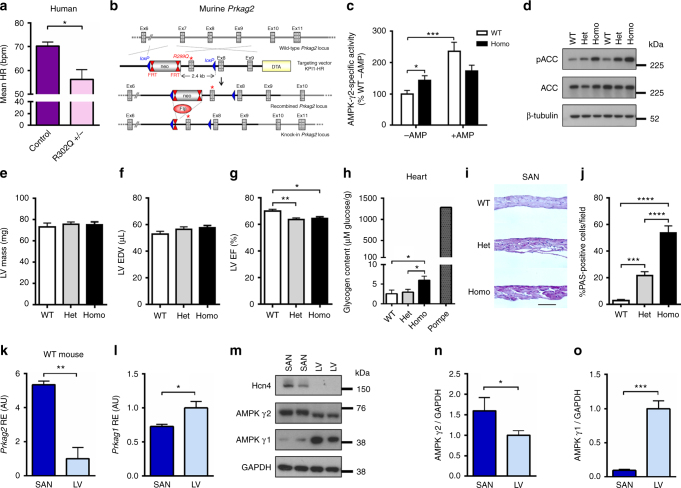
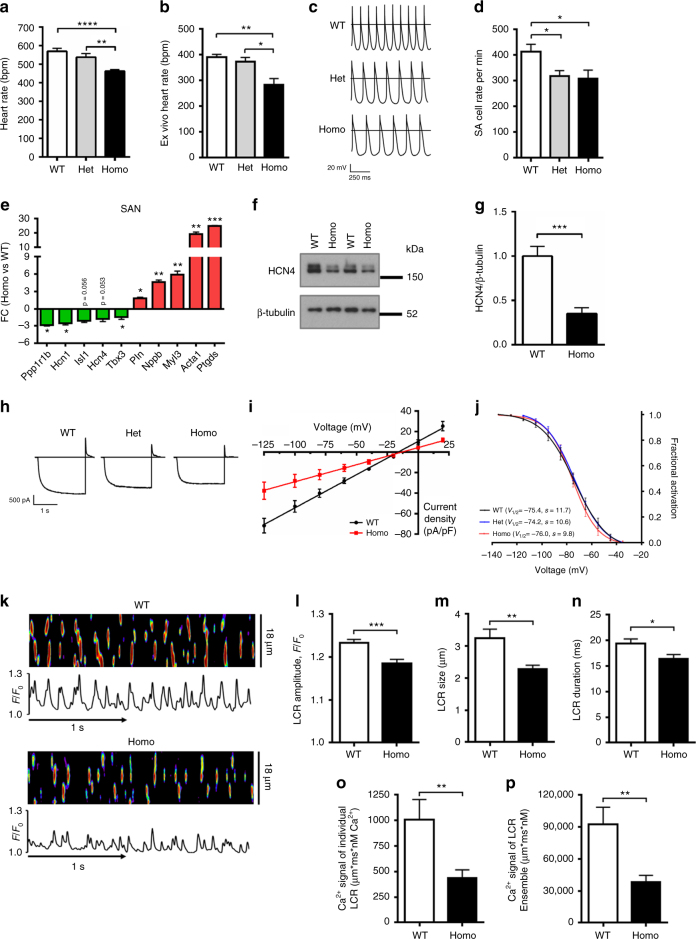
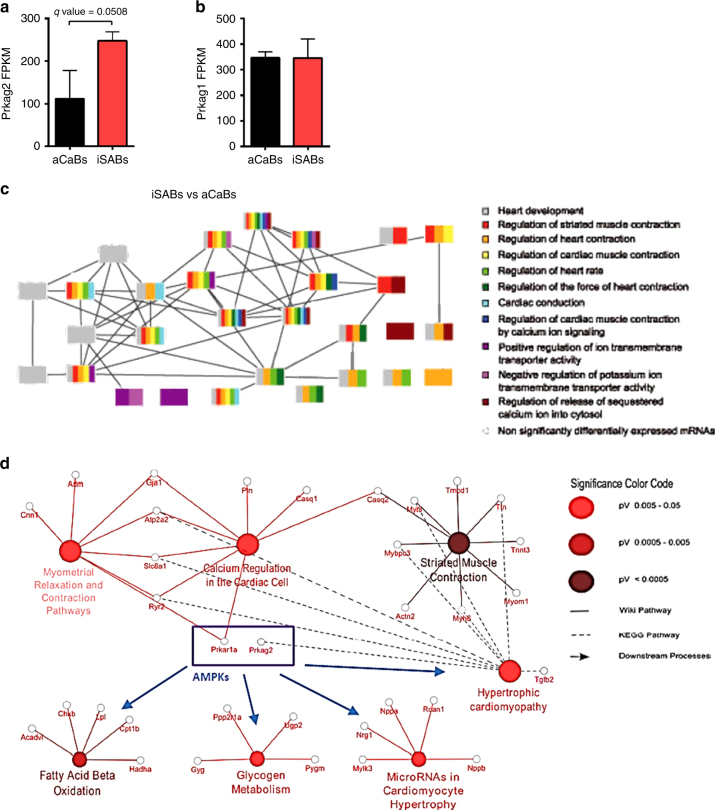
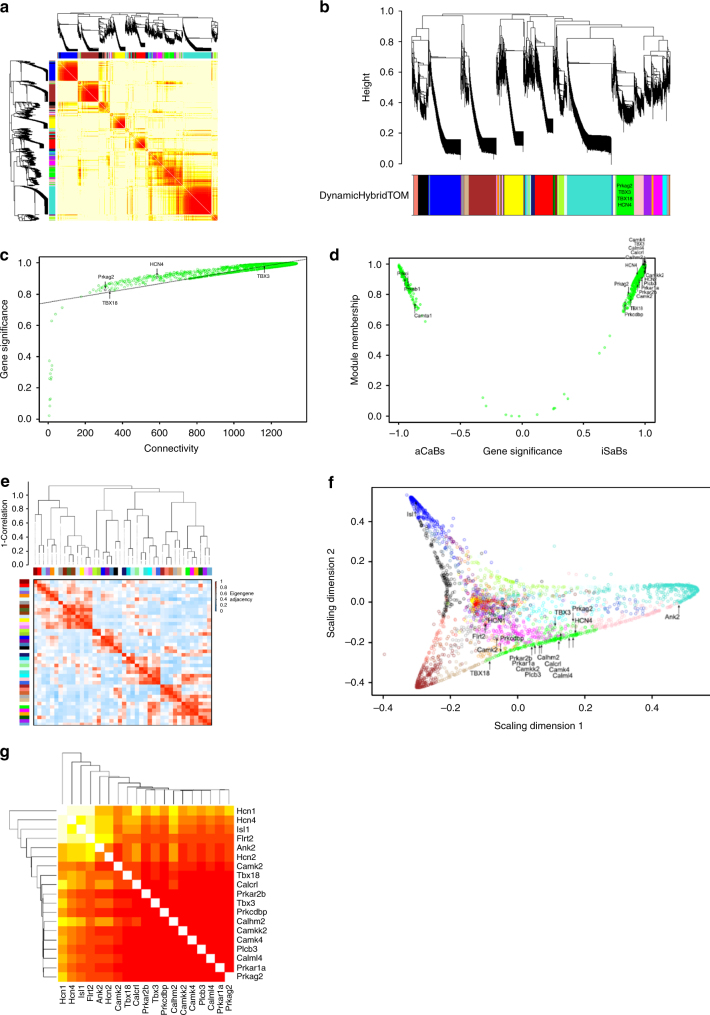
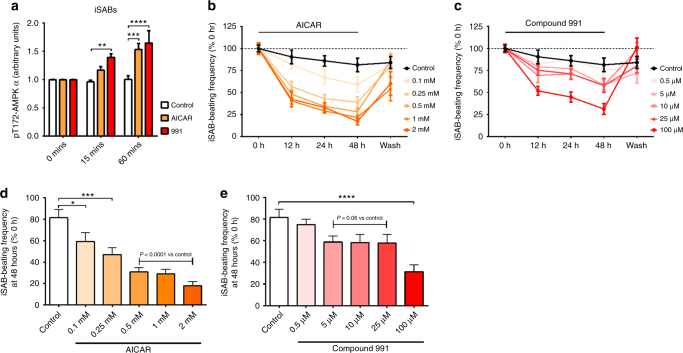
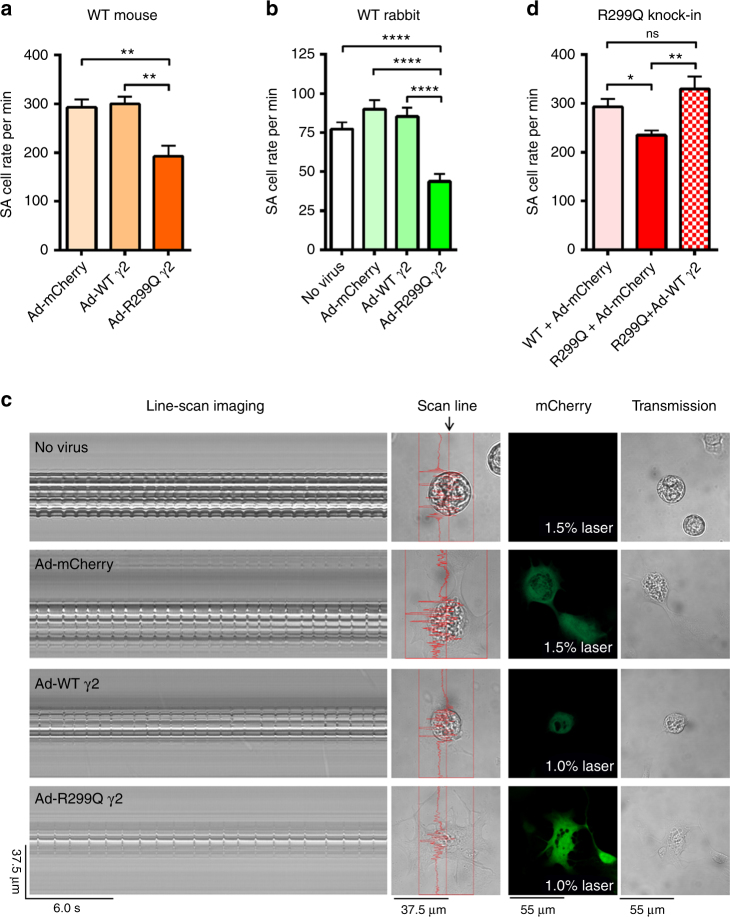
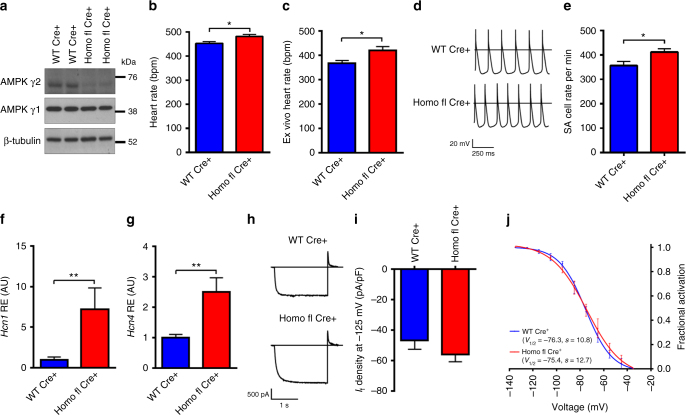
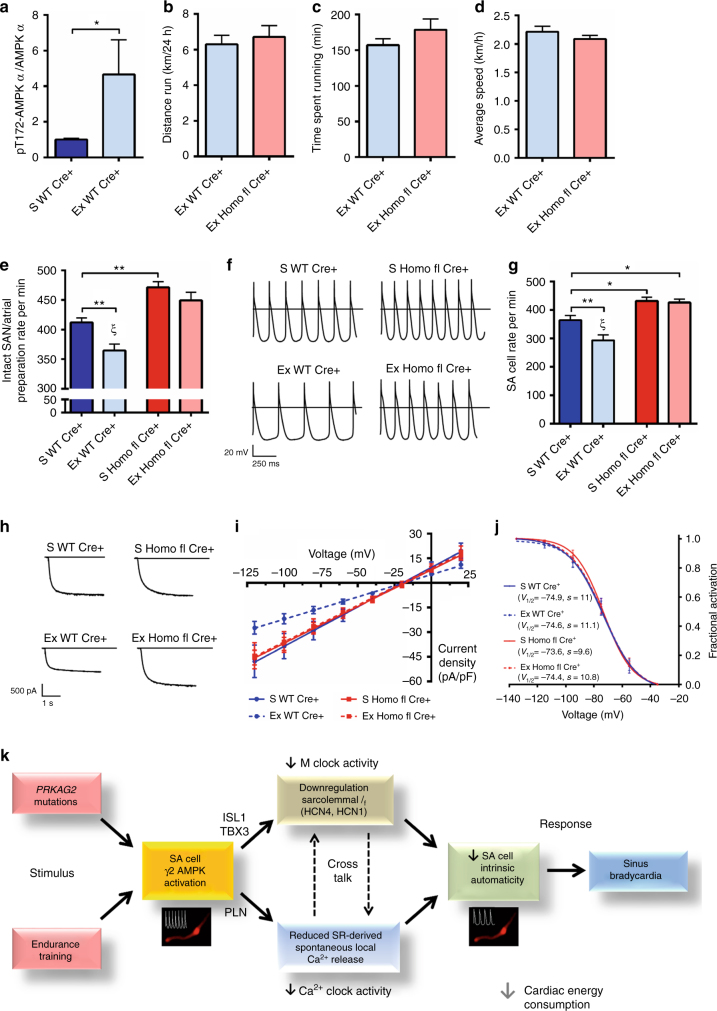
AMPK is a conserved serine/threonine kinase whose activity maintains cellular energy homeostasis. Eukaryotic AMPK exists as αβγ complexes, whose regulatory γ subunit confers energy sensor function by binding adenine nucleotides. Humans bearing activating mutations in the γ2 subunit exhibit a phenotype including unexplained slowing of heart rate (bradycardia). Here, we show that γ2 AMPK activation downregulates fundamental sinoatrial cell pacemaker mechanisms to lower heart rate, including sarcolemmal hyperpolarization-activated current (I f) and ryanodine receptor-derived diastolic local subsarcolemmal Ca2+ release. In contrast, loss of γ2 AMPK induces a reciprocal phenotype of increased heart rate, and prevents the adaptive intrinsic bradycardia of endurance training. Our results reveal that in mammals, for which heart rate is a key determinant of cardiac energy demand, AMPK functions in an organ-specific manner to maintain cardiac energy homeostasis and determines cardiac physiological adaptation to exercise by modulating intrinsic sinoatrial cell behavior.


Conflict of interest statement

The authors declare no competing financial interests.

Figures

Fig. 1
Fig. 1
Generation of the R299Q γ2 AMPK knock-in mouse and enrichment of γ2 AMPK in WT SA nodes. a Mean 24-h heart rate (HR) of human heterozygous R302Q γ2 mutation carriers (age 41.2 ± 2.8 years) vs genotype-negative sibling controls (age 38.9 ± 2.3 years) (n = 10–15). All subjects had any anti-arrhythmic drugs or β-adrenoceptor blockers discontinued for 5 days prior to ECG and none were on amiodarone. b Schematic of gene-targeting strategy to generate the R299Q γ2 AMPK knock-in. Neo, neomycin selection cassette; FRT, Flp recombinase recognition target; red asterisk denotes mutation in exon 7 of Prkag2. c γ2 AMPK-specific activity of freeze-clamped ex vivo perfused hearts measured by SAMS peptide phophorylation assay in the absence or presence of AMP (n = 18–22). d Representative western blot of whole heart tissue from R299Q γ2 and WT mice for phospho-(p) ACC (n = 11–15). eg Cine MRI analysis of left ventricular (LV) mass (e), end-diastolic volume (EDV) (f) and ejection fraction (EF) (g) in R299Q γ2 and WT mice aged 2 months (n = 8–19). h Cardiac tissue glycogen content from 12 month R299Q γ2 and WT mice together with a positive control heart from a homozygous Gaa (encoding acid α-glucosidase) knockout mouse (n = 12–15). i, j Periodic acid-Schiff (PAS) staining (i) (scale bar, 5 µm) and quantification of glycogen content (j) (as %PAS-positive cells/field) of SA node (SAN) sections (n = 12). k, l Quantitative real-time PCR (qRT-PCR) of γ2 and γ1 AMPK isoform relative gene expression levels (normalized to β-actin) from normal murine SA node and LV (SAN, n = 4; LV, n = 10). mo Western blot (m) and densitometry (n, o) of γ2 and γ1 AMPK in normal murine SA node and LV, together with SA node positive (HCN4) and loading (GAPDH) controls (n = 6–8). Uncropped western blots are shown in Supplementary Fig. 10. a, k, l, n, o Student’s t-test was performed. c Kruskal–Wallis test followed by Dunn’s multiple comparisons test was performed. eh, j One-way analysis of variance (ANOVA) followed by Holm–Sidak’s multiple comparisons test was performed. *P < 0.05, **P < 0.01, ***P < 0.001, ****P < 0.0001. RE relative expression, AU arbitrary units. a, c, eh, jl, n, o Data are shown as means ± s.e.m.
Fig. 2
Fig. 2
γ2 AMPK activation lowers intrinsic HR by downregulating SA cell I f and Ca2+ clock pacemaker mechanisms. a HR in beats per minute (bpm) of R299Q γ2 and WT mice under anesthesia (n = 7–12). b HR during ex vivo-isolated cardiac perfusion (n = 6–11). c Representative action potentials from SA cells isolated from R299Q γ2 and WT mice. d Mean beating rate of SA cells from groups illustrated in c (n = 17 cells). e qRT-PCR validation of differentially expressed genes on SA node microarray (n = 3). FC fold-change. f, g Representative western blot (f) and analysis (g) of HCN4 levels in SA nodes from R299Q γ2 and WT mice. h Representative SA cell I f traces during steps to −125 mV. i Mean fully activated I/V curves (I f density plotted against membrane voltage) recorded in WT and R299Q γ2 SA cells. Linear data fitting yielded significant differences (P < 0.0001) in I f slope conductance (648 and 333 pS/pF for WT and homozygous R299Q γ2 SA cells, respectively) (n = 8–10 cells/2–6 mice). j Mean voltage dependence of I f activation of WT and R299Q γ2 SA cells (n = 6 per genotype). Half-activation voltages (V 1/2, mV) and inverse-slope factors (s, mV) depicted. k Representative confocal line-scan images and Ca2+ transients of isolated, single, permeabilized WT, and homozygous R299Q γ2 SA node cells bathed in 50 nmol/L free [Ca2+]. ln Mean spontaneous local Ca2+ release (LCR) amplitude (l) expressed as peak value (F) normalized to minimal (F 0) fluorescence, size (m), and duration (n). o, p Ca2+ signal of individual LCR (o) and LCR ensembl (p) (n = 15–17 cells/3 mice per genotype). Uncropped western blots are shown in Supplementary Fig. 10. a, b, d One-way ANOVA followed by Holm–Sidak’s multiple comparisons test was performed. i Comparison of the slopes of linear regression lines was performed. e, g, lp Student’s t-test was performed. *P < 0.05, **P < 0.01, ***P < 0.001, ****P < 0.0001. a, b, d, e, g, lp Data are shown as means ± s.e.m.
Fig. 3
Fig. 3
RNA-Seq-derived expression levels of γ AMPK isoforms and gene ontology analysis of iSABs vs aCaBs. a, b Prkag2 (a) and Prkag1 (b) gene expression in iSABs (induced sinoatrial bodies) vs aCaBs (antibiotic-selected cardiac bodies—a mixture of cardiomyocyte subtypes) by RNA-Seq (n = 3). c, d Functional annotation with gene ontology (GO) analysis of iSAB gene expression identifying enrichment of GO terms associated with pacemaking (c) and significant enrichment of AMPK-dependent downstream targets and ontological processes (d). a, b Data are shown as means ± s.e.m.
Fig. 4
Fig. 4
WGCN analysis identifies Prkag2 in a central hub of pacemaker regulating genes. a Weighted gene co-expression network (WGCN) analysis-derived visualization of the iSAB–aCaB gene network by heat map plot. The heat map shows the topological overlap matrix (TOM) among all genes in the analysis. Light yellow represents low overlap and darker red represents higher overlap. Blocks along the diagonal are modules. Dendrograms and module color assignments are shown at the top and along the left side, respectively. b Refinement of the gene modules showing the gene dendrogram (average linkage) and module color assignment based on dynamic hybrid TOM clustering. c Plot of gene significance and intra-modular connectivity illustrating high correlation within the green module containing Prkag2. d Plot of co-expressed genes in the green module vs gene significance subdividing iSABs and aCaBs. e Further investigation of the relationship and connectivity among the investigated modules illustrated by (upper portion) a hierarchical clustering dendrogram (average linkage) and (lower portion) eigenvalue adjacency heatmap. f Multi-dimensional scaling plot identifying the green module as a major signaling hub connecting multiple genes critical to pacemaker functionality. g Heat map illustrating the TOM among genes depicted in e. Each column and row refers to a single gene. Light yellow represents low overlap and darker red represents higher overlap
Fig. 5
Fig. 5
Pharmacological activation of AMPK reduces the spontaneous beating rate of iSABs. a ELISA analysis of α AMPK Thr172 phosphorylation in iSABs treated with the AMPK activator AICAR- or the small-molecule AMPK activator compound 991 (n = 4). b Effect of incubation with variable doses of AICAR or control on iSAB-beating rate. c Effect of incubation with variable doses of compound 991 or control on iSAB-beating rate. d Bar chart representation of AICAR dose–response effect data shown in b specifically for the 48 h incubation time point. e Bar chart representation of compound 991 dose–response effect data shown in c specifically for the 48 h incubation time point. a Two-way ANOVA was performed. d, e One-way ANOVA followed by Holm–Sidak’s multiple comparisons test was performed. *P < 0.05, **P < 0.01,***P < 0.001, ****P < 0.0001. ae Data are shown as means ± s.e.m.
Fig. 6
Fig. 6
Adenovirus-mediated γ2 AMPK gain-of-function reduces intrinsic firing rate of WT mammalian SA cells. a Mean firing rates of SA cells isolated from WT C57BL/6J mice following infection with adenoviruses carrying control (Ad-mCherry), WT γ2 (Ad-WT γ2), or R299Q γ2 (Ad-R299Q γ2) constructs (n = 7–9). b Mean spontaneous beating rate of WT rabbit SA cells following adenoviral infection (n = 29–36). c Representative line-scan images of spontaneous contraction (column 1), scan line (column 2), mCherry density (column 3), and corresponding transmission images (column 4) of WT rabbit SA cells following adenoviral infection. d Mean firing rates of SA cells isolated from homozygous R299Q γ2 mice following adenoviral infection with control (Ad-mCherry) or WT γ2 constructs (n = 5–9). Mean firing rate of WT SA cells following infection with Ad-mCherry (bar identical to that in a) also depicted for comparison. a, b, d One-way ANOVA followed by Holm–Sidak’s multiple comparisons test was performed. *P < 0.05, **P < 0.01, ***P < 0.001, ****P < 0.0001; ns not significant. a, b, d Data are shown as means ± s.e.m
Fig. 7
Fig. 7
Loss of γ2 AMPK increases resting heart rate and SA cell automaticity. a Cardiac western blot for γ AMPK isoforms in Sox2cre-driven γ2 knockout mice (Homo fl Cre+) and WT Sox2cre carrying controls (WT Cre+). b HR of Homo fl Cre+ and WT Cre+ mice under anesthesia (n = 7–12). c HR during ex vivo-isolated cardiac perfusion (n = 8–9). d Representative action potentials recorded from isolated SA cells. e Mean beating rate of SA cells from genotypes illustrated in d (n = 18–20 cells/3–5 mice). f, g Relative gene expression (by qRT-PCR) of Hcn1 and Hcn4 from whole hearts (n = 5–6). h Representative I f traces during steps to −125 mV. (i) Mean I f density at −125 mV (n = 28–31 cells/7–8 mice). j Mean voltage dependence of I f activation of isolated SA cells (n = 7–9). Uncropped western blots are shown in Supplementary Fig. 10. b, c, eg, i Student’s t-test was performed. *P < 0.05, **P < 0.01. b, c, eg, i Data are shown as means ± s.e.m.
Fig. 8
Fig. 8
γ2 AMPK is critically required for the intrinsic bradycardic adaptation to endurance exercise. a Results of western blot analysis of α AMPK Thr172 phosphorylation in whole heart tissue from sedentary (S) and exercised (Ex, 10 weeks of voluntary wheel running) WT Cre+ mice (n = 8–10). bd Average daily distance (b), time (c), and speed (d) of voluntary wheel running during a 10–week training period of WT Cre+ and Homo fl Cre+ mice (n = 17–26). e Spontaneous beating rate of isolated intact SA node/atrial preparations from S and Ex WT Cre+ and Homo fl Cre+ mice (n = 10–22). f Representative action potentials recorded from isolated SA cells. g Mean beating rate of isolated SA cells from S and Ex groups (n = 12–27 cells). h Representative SA cell I f traces during steps to −125 mV. i Mean fully activated I/V curves recorded in SA cells. Linear data fitting yielded statistically significant differences (P < 0.0001) in I f slope conductance of SA cells from exercised WT Cre+ mice only, with conductance values of 481 (S WT Cre+), 447 (S Homo fl Cre+), 272 (Ex WT Cre+) and 447 pS/pF (Ex Homo fl Cre+) (n = 6–14 cells/4–8 mice per group). j Mean voltage-dependence of I f activation of SA cells from both S and Ex groups (n = 6–15). k Schematic depicting the central function of SA cell γ2 AMPK in overall cardiac energy accounting. ad Student’s t-test was performed; e, g, one-way ANOVA followed by (e) Holm–Sidak’s multiple comparisons test or (g) Fisher’s least significant difference test was performed. *P < 0.05, **P < 0.01, ξ P < 0.0001 for both Ex WT Cre+ vs S Homo fl Cre+ and Ex WT Cre+ vs Ex Homo fl Cre+ comparisons. ae, g Data are shown as means ± s.e.m.

References

    1. Oakhill JS, et al. AMPK is a direct adenylate charge-regulated protein kinase. Science. 2011;332:1433–1435. doi: 10.1126/science.1200094. - DOI - PubMed
    1. Xiao B, et al. Structural basis for AMP binding to mammalian AMP-activated protein kinase. Nature. 2007;449:496–500. doi: 10.1038/nature06161. - DOI - PubMed
    1. Bungard D, et al. Signaling kinase AMPK activates stress-promoted transcription via histone H2B phosphorylation. Science. 2010;329:1201–1205. doi: 10.1126/science.1191241. - DOI - PMC - PubMed
    1. Chantranupong L, Wolfson RL, Sabatini DM. Nutrient-sensing mechanisms across evolution. Cell. 2015;161:67–83. doi: 10.1016/j.cell.2015.02.041. - DOI - PMC - PubMed
    1. Kahn BB, Alquier T, Carling D, Hardie DG. AMP-activated protein kinase: ancient energy gauge provides clues to modern understanding of metabolism. Cell Metab. 2005;1:15–25. doi: 10.1016/j.cmet.2004.12.003. - DOI - PubMed

Publication types

MeSH terms

Substances