

Published Erratum
doi: 10.1155/2017/4576985.
Epub 2017 Sep 20.
Erratum to "Long-Term Treatment of Native LDL Induces Senescence of Cultured Human Endothelial Cells"
Affiliations
- PMID: 29098060
- PMCID: PMC5642452
- DOI: 10.1155/2017/4576985
Item in Clipboard
Published Erratum
Erratum to "Long-Term Treatment of Native LDL Induces Senescence of Cultured Human Endothelial Cells"
Oxid Med Cell Longev.
2017.
Abstract
[This corrects the article DOI: 10.1155/2017/6487825.].
Figures
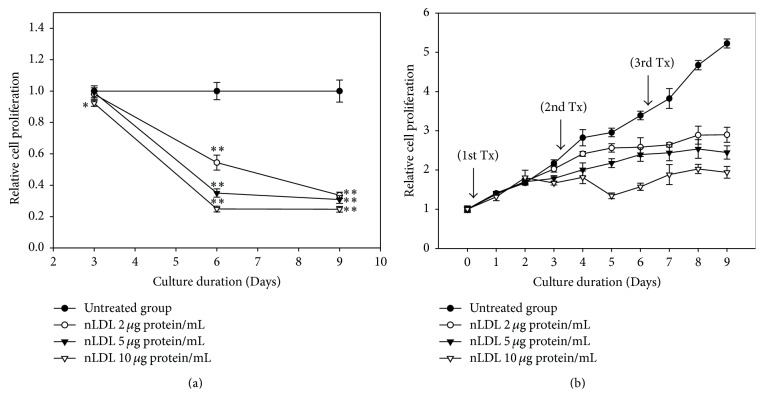
Effect of long-term treatment with nLDL on the proliferation of HUVECs. Young HUVECs (PDL, 12~15) were subcultured at every third day of each subculture with media exchange (a) and cultured continuously in the same culture dish with media exchange (b), for up to 9 days. The cells were treated with various concentrations of nLDL (0, 2, 5, and 10 μg protein/mL) concomitantly with media exchange every 3 days at both culture systems (1st, 2nd, and 3rd Tx). Cellular proliferation of the cells was analyzed by tetrazolium salt method. The degree of cellular proliferation was expressed as the relative ratio of cell number. The dose- and time-dependent differences in cellular proliferation between groups were analyzed statistically by repeated measures ANOVA assay (p < 0.01). Each nLDL-treated group was also compared with the respective nLDL-untreated group by independent t-test. ∗p < 0.05; ∗∗p < 0.01. Each result represents the mean ± SD (n = 6).
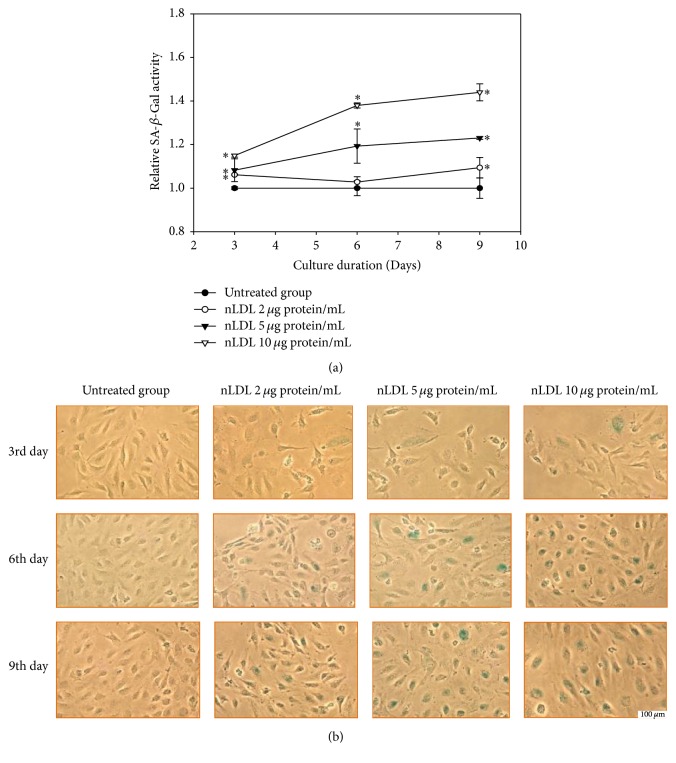
Senescence induction in HUVECs by long-term treatment with nLDL (0, 2, 5, and 10 μg protein/mL), for up to 9 days. (a) Quantitative assay of SA-β-Gal activity after nLDL treatment; (b), SA-β-Gal activity staining after nLDL treatment. HUVECs were treated with nLDL at the start of each subculture and assayed for SA-β-Gal activity at the end of each subculture. The SA-β-Gal activity was expressed as the generation rate of 4-methylumbelliferone (MU)/μg protein against that of the respective nLDL-untreated group. The dose- and time-dependent differences in SA-β-Gal activity between groups (a) were an alyzed statistically by repeated measures ANOVA assay (p < 0.01). Each nLDL-treated group was also compared with the respective nLDL-untreated group by independent t-test (∗p < 0.01). Each result represents the mean ± SD (n = 3).
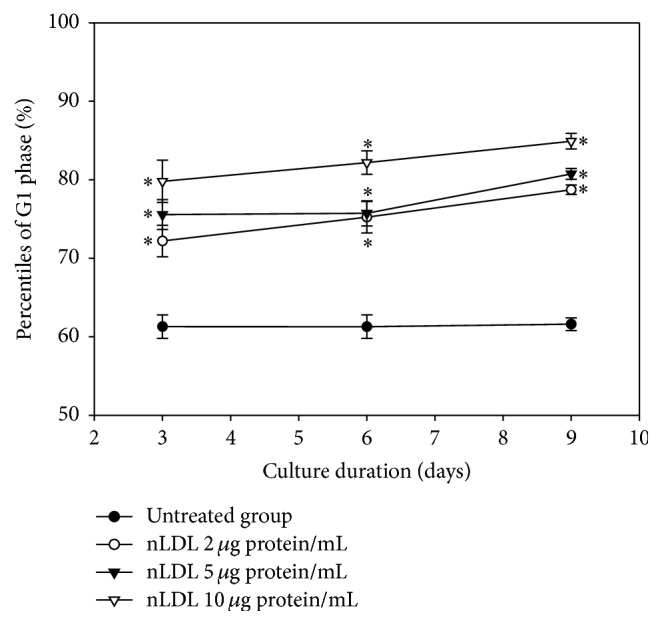
G1 arrest induction in HUVECs by long-term treatment with nLDL. Cell cycle was assayed by flow cytometry in the nLDL-treated cells, for up to 9 days, at the end of each subculture. The distribution percentiles of G1 phase cells after nLDL treatment (0, 2, 5, and 10 μg protein/mL) were shown as a line graph. The dose- and time-dependent differences in G1 phase distribution between groups were analyzed statistically by repeated measures ANOVA assay (p < 0.01). Each nLDL-treated group was also compared with the respective nLDL-untreated group by independent t-test (∗p < 0.01). Each result represents the mean ± SD (n = 6).
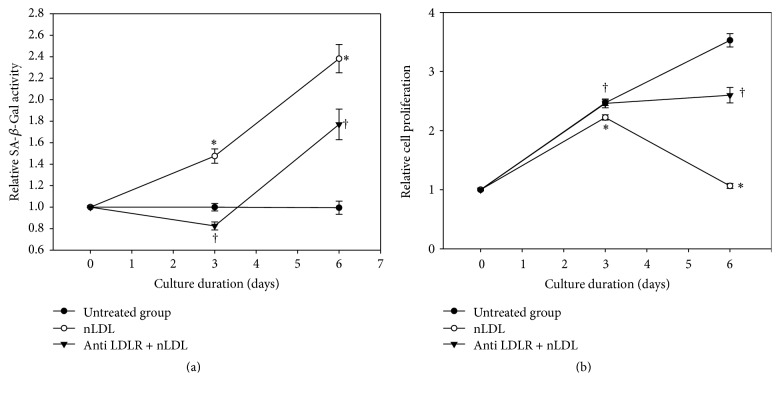
Effect of LDL receptor (LDLR) blocking with antibody on the nLDL-induction of senescence in HUVECs. The cells were pretreated with anti-LDLR antibody (20 μg protein/mL) before nLDL (10 μg protein/mL) treatment. The cells were cultured for up to 6 days. Senescence induction was carried out by SA-β-Gal activity assay in subcultured cells (a) and cellular proliferation by tetrazolium salt staining in continuously cultured cells (b), every 3 days. The time-dependent difference in SA-β-Gal activity or cellular proliferation between treatment groups was analyzed statistically by repeated measures ANOVA assay (p < 0.01). And also, each nLDL-treated group was compared with the respective nLDL-untreated group (∗p < 0.01) and each anti-LDLR antibody plus nLDL-treated group was compared with the respective nLDL-treated group (†p < 0.01) by independent t-test. Each result represents the mean ± SD (n = 6).
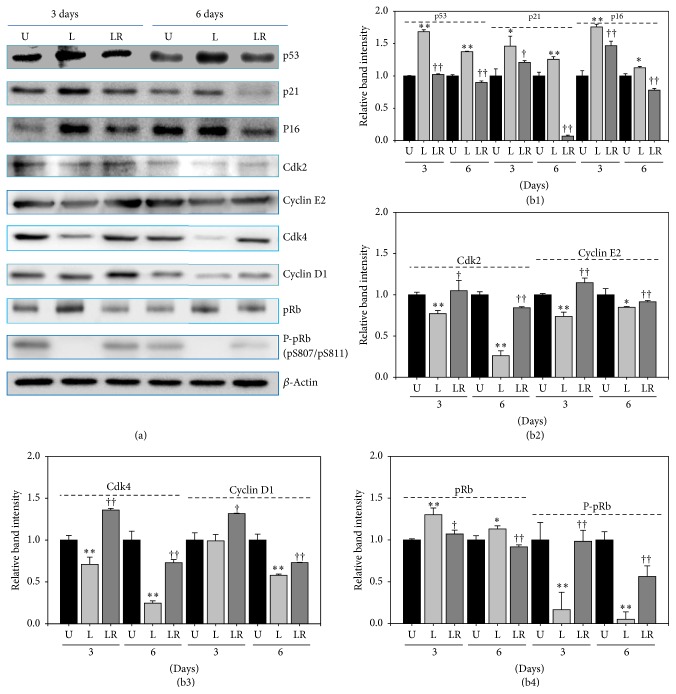
Changes in the content of some cell cycle-regulating proteins by long-term treatment with nLDL (10 μg protein/mL) in HUVECs and their restoration by pretreatment with anti-LDLR (20 μg protein/mL). The cells were untreated with nLDL (U), treated with nLDL (L), or treated with both anti-LDLR and nLDL (LR) at each subculture, for up to 6 days. At the end of each subculture, the content of some cell cycle-regulating proteins was assayed by Western blot analysis. (a) Western blot images; (b) quantification of Western blot bands. (b1) The contents of p53, p21, and p16 proteins were increased by nLDL treatment, with these effects compromised by the anti-LDLR pretreatment. (b2) The nLDL-induced decrease in Cdk2 and Cyclin E2 was compromised by the anti-LDLR pretreatment. (b3) The nLDL-induced decrease in Cdk4 and Cyclin D1 was compromised by anti-LDLR pretreatment. (b4) The content of pRb was increased and that of P-pRb (phosphorylated pRb) was decreased, with these effects compromised by the anti-LDLR pretreatment. Group L was compared with the nLDL-untreated group (U) by independent t-test (∗p < 0.05 and ∗∗p < 0.01). Group LR was compared with group L by independent t-test (†p < 0.05 and ††p < 0.01).

The generation of reactive oxygen species (ROS) with nLDL in HUVECs. The cells were subcultured and treated with nLDL (0, 2, 5, and 10 μg protein/mL) every 3 days of each subculture, for up to 9 days. ROS generation in nLDL-treated cells were analyzed by spectrofluorometry (a) and fluorescence microscopy (b) assays with DCF-DA at the end of each subculture. ROS generation was expressed as the relative fluorescence intensity/μg of protein of the nLDL-treated group, as compared to the untreated group. The dose- and time-dependent differences in ROS generation (a) between groups were analyzed statistically by repeated measures ANOVA assay (p < 0.01). Each nLDL-treated group was also compared with the respective nLDL-untreated group by independent t-test (∗p < 0.05 and ∗∗p < 0.01). Each result represents the mean ± SD (n = 3-4).
Erratum for
-
Long-Term Treatment of Native LDL Induces Senescence of Cultured Human Endothelial Cells.Oxid Med Cell Longev. 2017;2017:6487825. doi: 10.1155/2017/6487825. Epub 2017 Jan 19. Oxid Med Cell Longev. 2017. PMID: 28197300 Free PMC article.
References
Publication types
LinkOut - more resources
Full Text Sources
Other Literature Sources
