

How convincing is a matching Y-chromosome profile?
- PMID: 29099833
- PMCID: PMC5669422
- DOI: 10.1371/journal.pgen.1007028
How convincing is a matching Y-chromosome profile?
Abstract
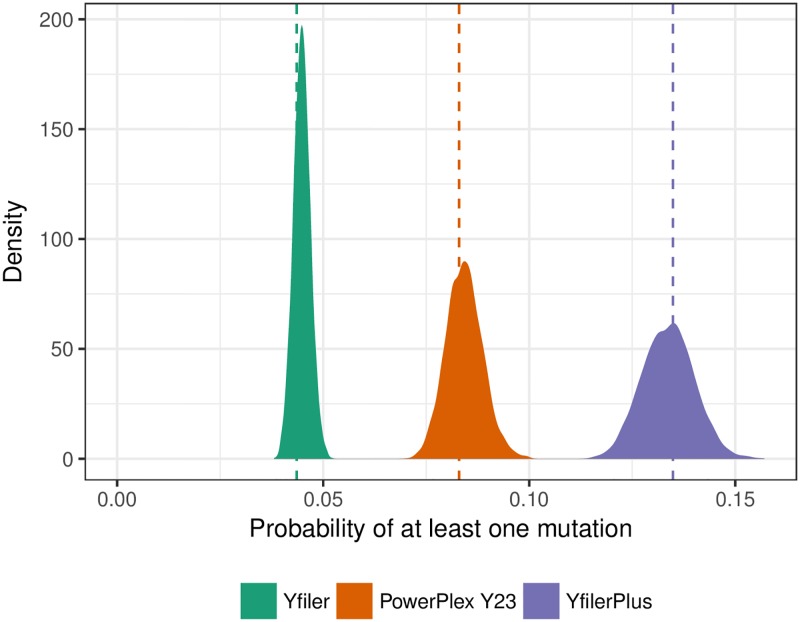
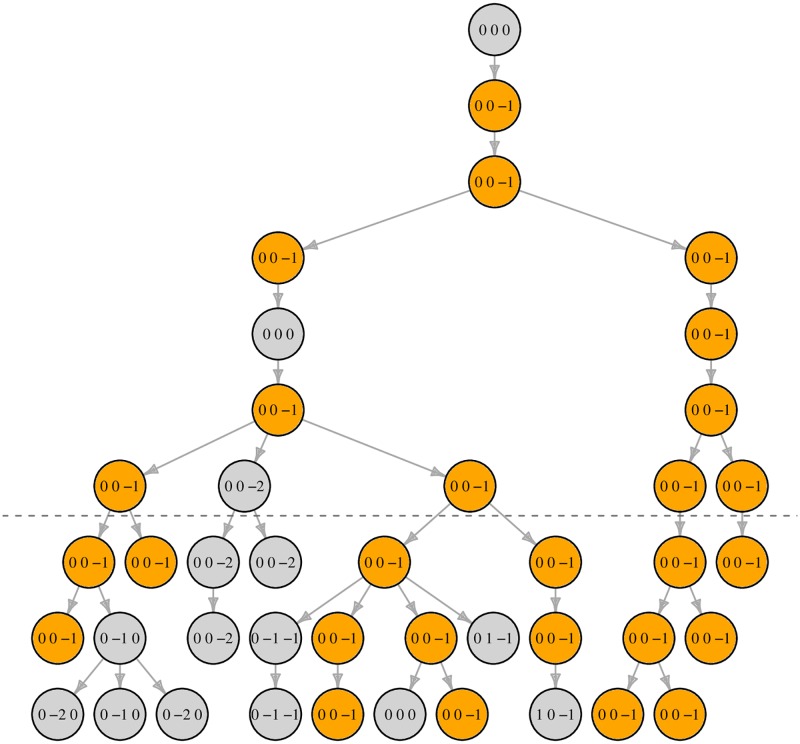
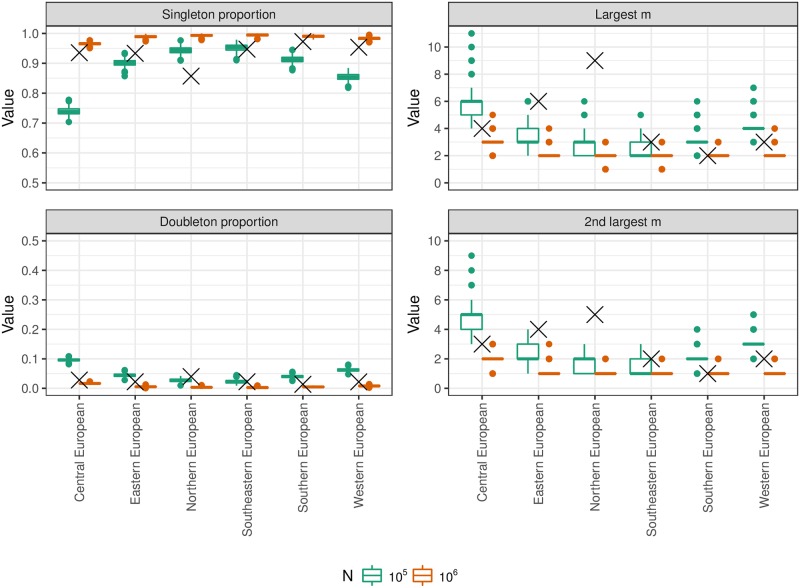
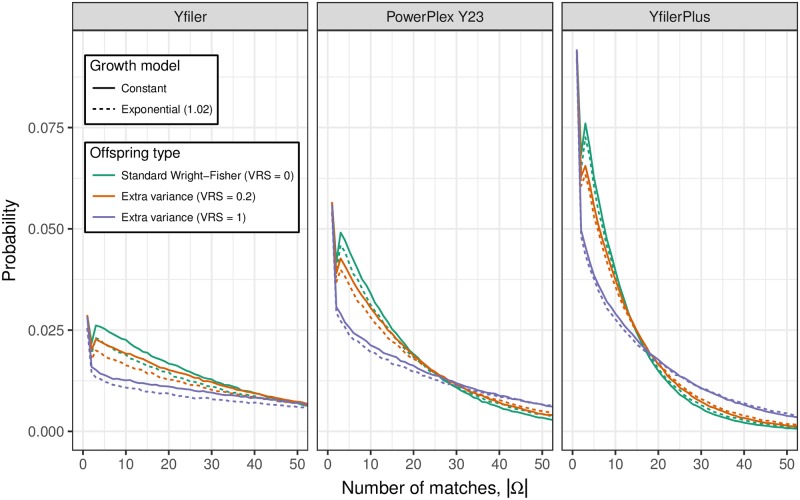
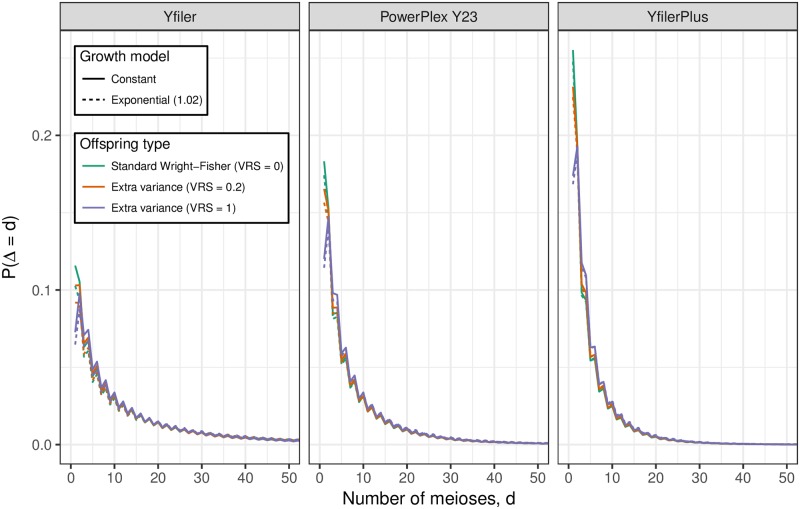
The introduction of forensic autosomal DNA profiles was controversial, but the problems were successfully addressed, and DNA profiling has gone on to revolutionise forensic science. Y-chromosome profiles are valuable when there is a mixture of male-source and female-source DNA, and interest centres on the identity of the male source(s) of the DNA. The problem of evaluating evidential weight is even more challenging for Y profiles than for autosomal profiles. Numerous approaches have been proposed, but they fail to deal adequately with the fact that men with matching Y-profiles are related in extended patrilineal clans, many of which may not be represented in available databases. The higher mutation rates of modern profiling kits have led to increased discriminatory power but they have also exacerbated the problem of fairly conveying evidential value. Because the relevant population is difficult to define, yet the number of matching relatives is fixed as population size varies, it is typically infeasible to derive population-based match probabilities relevant to a specific crime. We propose a conceptually simple solution, based on a simulation model and software to approximate the distribution of the number of males with a matching Y profile. We show that this distribution is robust to different values for the variance in reproductive success and the population growth rate. We also use importance sampling reweighting to derive the distribution of the number of matching males conditional on a database frequency, finding that this conditioning typically has only a modest impact. We illustrate the use of our approach to quantify the value of Y profile evidence for a court in a way that is both scientifically valid and easily comprehensible by a judge or juror.
Conflict of interest statement
The authors have declared that no competing interests exist.
Figures
References
-
- Butler J, Decker A, Kline M, Vallone P. Chromosomal duplications along the Y chromosome and their potential impact on Y-STR interpretation. J Forensic Sci. 2005;50(4):853–9. doi: 10.1520/JFS2004481 - DOI - PubMed
-
- de Knijff P. Son, Give Up Your Gun: Presenting Y-STR Results in Court. Profiles in DNA. 2003;6(2):3–5.
-
- Steele CD, Balding D. Weight of evidence for forensic DNA profiles. 2nd ed Wiley; 2015.
-
- Caliebe A, Jochens A, Willuweit S, Roewer L, Krawczak M. No shortcut solution to the problem of Y-STR match probability calculation. Forensic Science International: Genetics. 2015;15:69–75. doi: 10.1016/j.fsigen.2014.10.016 - DOI - PubMed
-
- Brenner C. Understanding Y haplotype matching probability. Forensic Science International: Genetics. 2014;8:233–43. doi: 10.1016/j.fsigen.2013.10.007 - DOI - PubMed
MeSH terms
Substances
LinkOut - more resources
Full Text Sources
Other Literature Sources
Molecular Biology Databases
