. 2017 Nov 2;21(5):591-603.e4.
doi: 10.1016/j.stem.2017.10.002.

Targeting Glioma Stem Cell-Derived Pericytes Disrupts the Blood-Tumor Barrier and Improves Chemotherapeutic Efficacy

Affiliations

Targeting Glioma Stem Cell-Derived Pericytes Disrupts the Blood-Tumor Barrier and Improves Chemotherapeutic Efficacy

Wenchao Zhou et al. Cell Stem Cell. .

Abstract

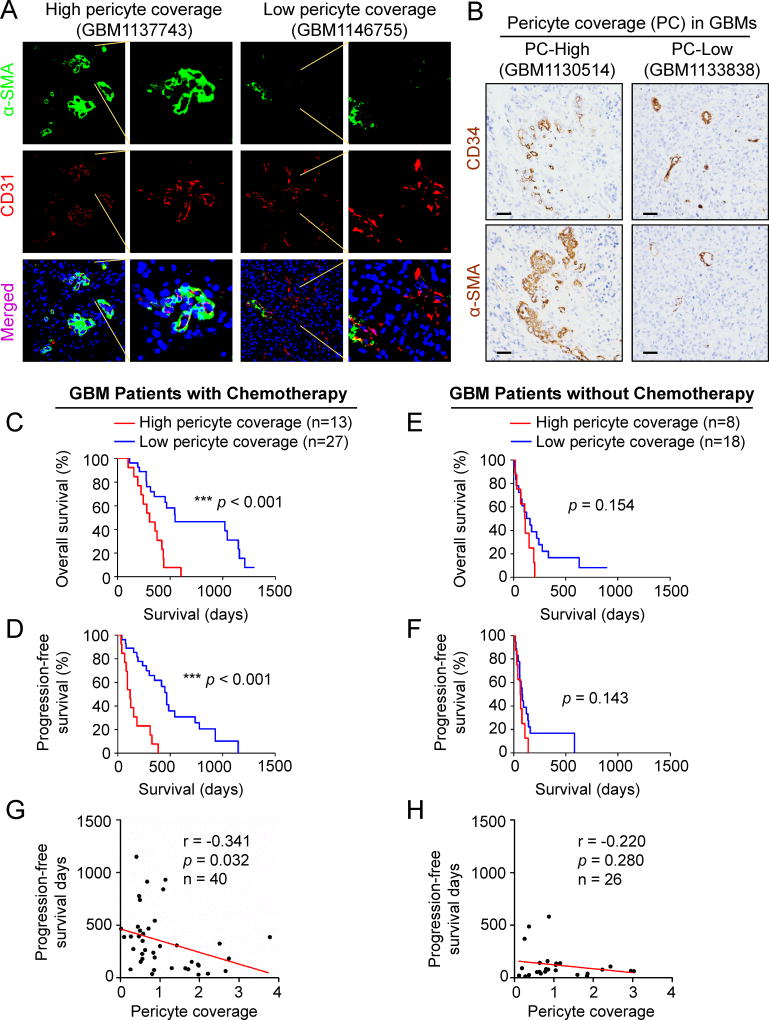
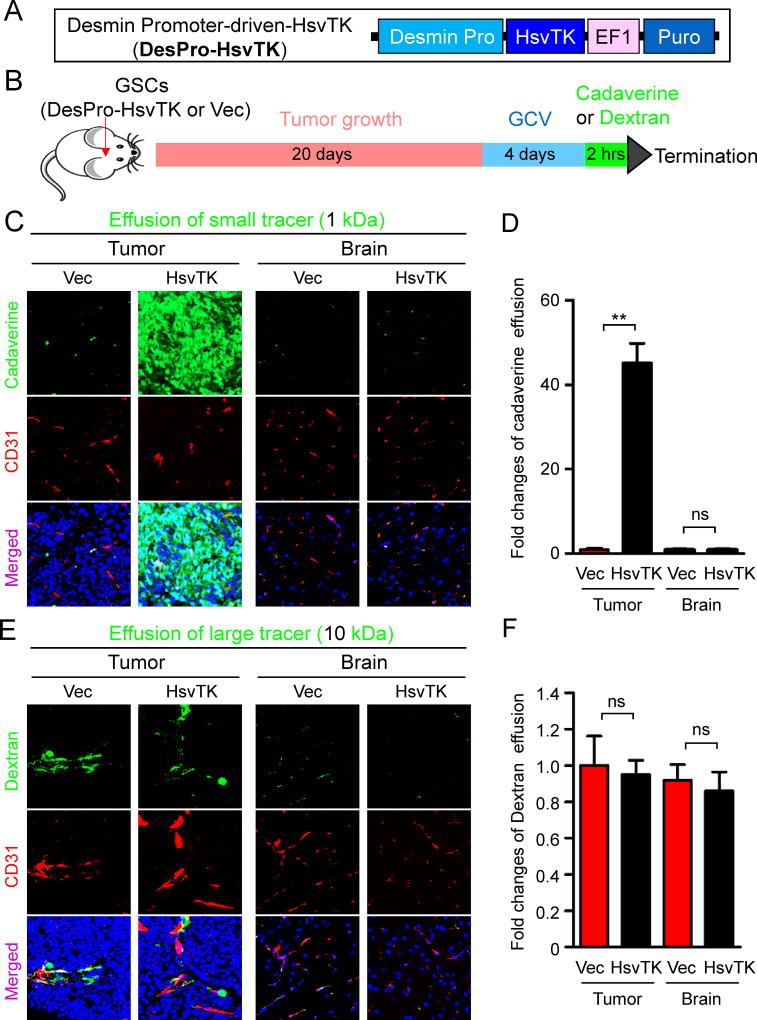
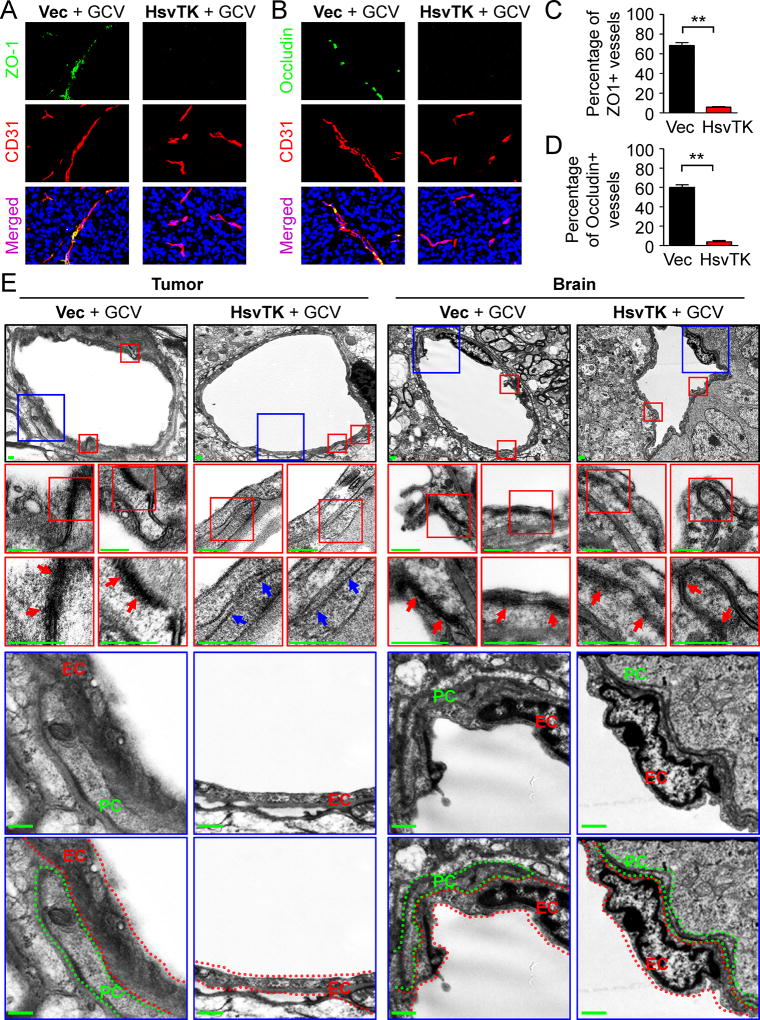
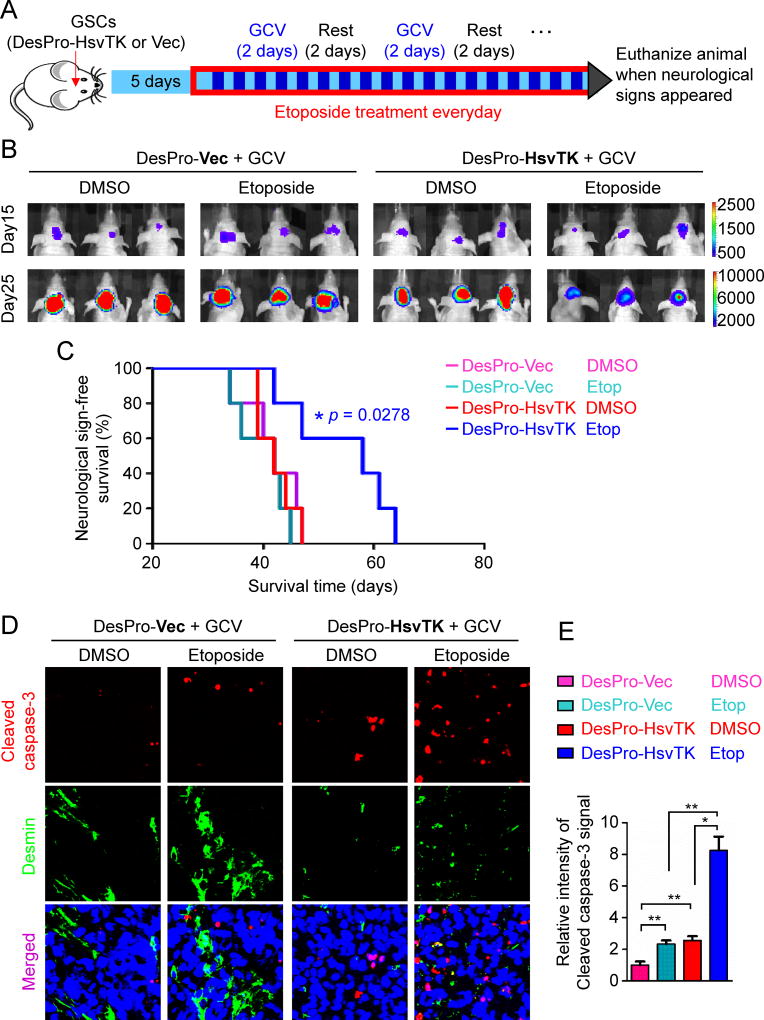
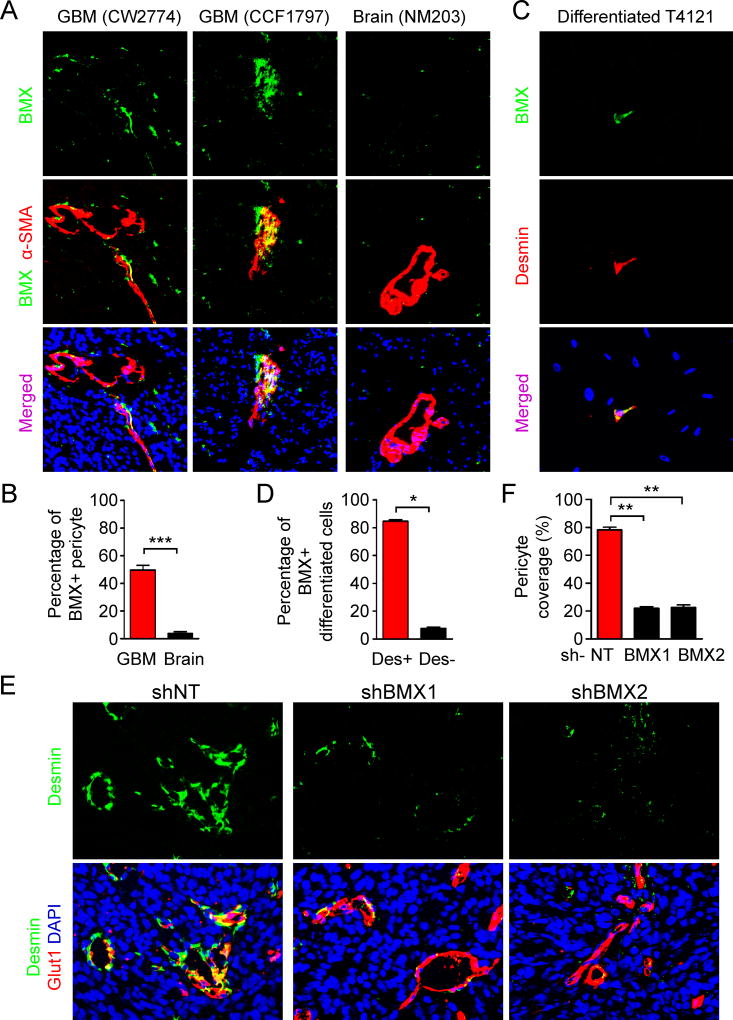
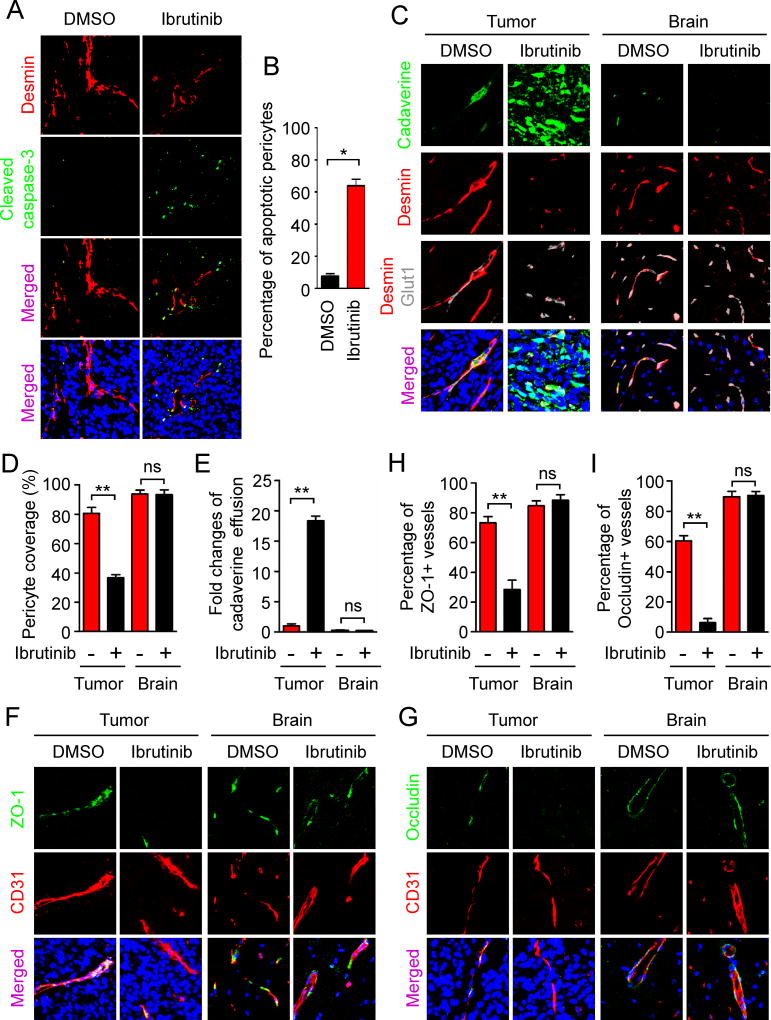
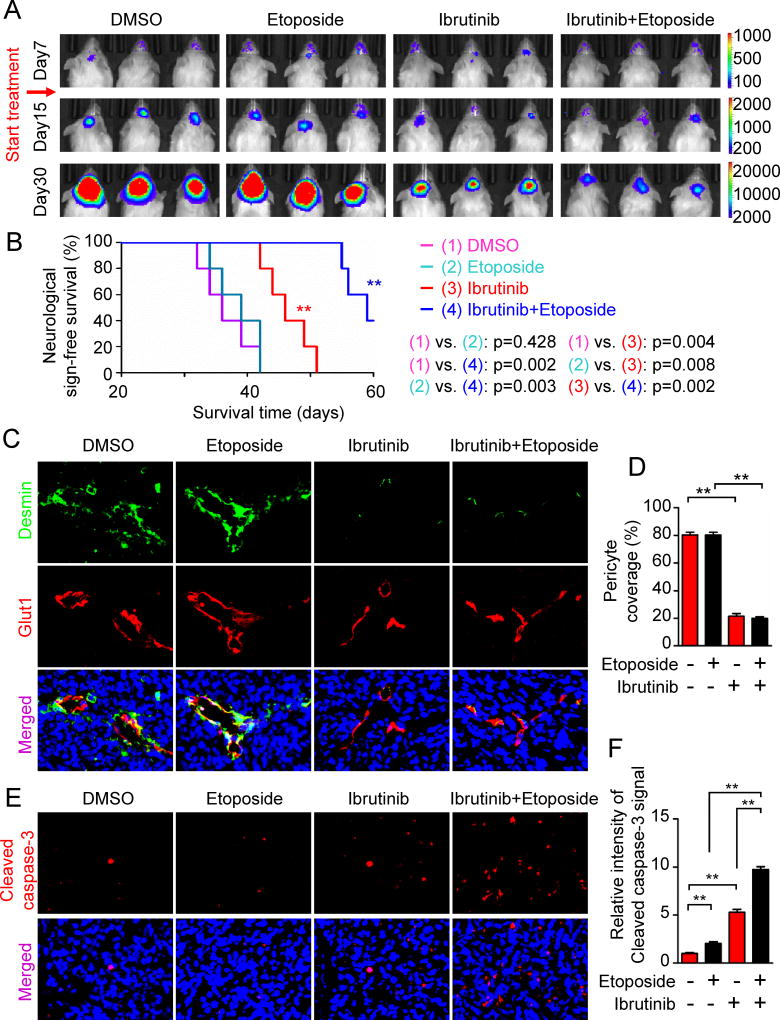
The blood-tumor barrier (BTB) is a major obstacle for drug delivery to malignant brain tumors such as glioblastoma (GBM). Disrupting the BTB is therefore highly desirable but complicated by the need to maintain the normal blood-brain barrier (BBB). Here we show that targeting glioma stem cell (GSC)-derived pericytes specifically disrupts the BTB and enhances drug effusion into brain tumors. We found that pericyte coverage of tumor vasculature is inversely correlated with GBM patient survival after chemotherapy. Eliminating GSC-derived pericytes in xenograft models disrupted BTB tight junctions and increased vascular permeability. We identified BMX as an essential factor for maintaining GSC-derived pericytes. Inhibiting BMX with ibrutinib selectively targeted neoplastic pericytes and disrupted the BTB, but not the BBB, thereby increasing drug effusion into established tumors and enhancing the chemotherapeutic efficacy of drugs with poor BTB penetration. These findings highlight the clinical potential of targeting neoplastic pericytes to significantly improve treatment of brain tumors.

Keywords: BMX; blood-brain barrier (BBB); blood-tumor barrier (BTB); glioma stem cells; ibrutinib; pericytes.


Conflict of interest statement

The authors declare no competing financial interests.

Figures

Figure 1
Figure 1. High Pericyte Coverage Predicts Poor Prognosis of GBM Patients in Response to Chemotherapy
(A) Representative immunofluorescent images of human primary GBMs with high or low pericyte coverage stained for the tumor pericyte marker α-SMA (green), the endothelial marker CD31 (red), and nuclei with DAPI (blue) (scale bar, 80µm). (B) Representative immunohistochemical images of human primary GBMs with high or low pericyte coverage. Consecutive paraffin sections were stained for α-SMA or the endothelial marker CD34 (scale bar, 80µm). (C and D) Kaplan-Meier survival curves show an inverse correlation between pericyte coverage and overall survival (C) or progression-free survival (D) of GBM patients treated with chemotherapy (n = 40). Pericyte coverage was defined as the ratio of α-SMA intensity to the CD34 intensity. The average pericyte coverage of all GBMs was used as the cut-off to divide GBM patients into high and low pericyte coverage groups. (n = 27 for low pericyte coverage, n = 13 for high pericyte coverage; ***, p < 0.001, two-tailed log-rank test). (E and F) Kaplan-Meier survival curves show no correlation between pericyte coverage and overall survival (E) or progression-free survival (F) of GBM patients without chemotherapy (n = 26). Similar analyses described in (C and D) were performed in a cohort of GBM patients who did not receive any chemotherapy. (n = 18 for low pericyte coverage, n = 8 for high pericyte coverage; two-tailed log-rank test). (G and H) Linear regression analysis of the correlation between pericyte coverage and progression-free survival of GBM patients treated with chemotherapy (G) (n = 40) or without chemotherapy (H) (n = 26). Pericyte coverage is inversely correlated to progression-free survival of patients treated with chemotherapy (G) (n = 40, p = 0.032, r = −0.341). No correlation is observed between pericyte coverage and progression-free survival of GBM patients without chemotherapy (H) (n = 26, p = 0.28, r = −0.22). See also Figure S1 and Table S1.
Figure 2
Figure 2. Selective Elimination of GSC-derived Pericytes Increased Vascular Permeability and Allowed Small Molecule Effusion into Intracranial GBM Xenografts
(A) A schematic presentation of the Desmin promoter-driven HsvTK construct (DesPro-HsvTK) for selective targeting of GSC-derived pericytes. The CMV promoter of the pCDH-CMV-MCS-EF1-Puro lentiviral vector was replaced by the Desmin promoter. The herpes simplex virus thymidine kinase (HsvTK) coding sequence was inserted behind the Desmin promoter. (B) A workflow of the study to test the effect of selective targeting of GSC-derived pericytes on vascular permeability. GSCs transduced with DesPro-HsvTK or DesPro-Vec were implanted into athymic mice to generate intracranial GBM xenografts. 20 days after implantation, mice were treated with GCV (1mg/20g) through intraperitoneal injection for 4 days. Then the fluorescent tracer cadaverine (1 kDa) or dextran (10 kDa) was introduced into the mice through tail vein injection (250µg/20g). 2 hours after tracer injection, mice were sacrificed and the mouse brains were harvested for subsequent analyses. (C) Detection of vascular permeability with the autonomous fluorescent tracer cadaverine (green) and immunofluorescent staining of CD31 (red) in xenografts derived from T4121 GSCs transduced with DesPro-HsvTK or DesPro-Vec after GCV treatment (scale bar, 80µm). (D) Statistical analysis of cadaverine effusion in xenografts derived from the GSCs transduced with DesPro-HsvTK or DesPro-Vec after GCV treatment (n = 5 tumors / group). (E) Detection of vascular permeability with the autonomous fluorescent tracer dextran (green) and immunofluorescent staining of CD31 (red) in xenografts derived from the GSCs transduced with DesPro-HsvTK or DesPro-Vec after GCV treatment (scale bar, 80µm). (F) Statistical quantification of dextran effusion into xenografts derived from the GSCs transduced with DesPro-HsvTK or DesPro-Vec after GCV treatment. (n = 5 tumors / group). Data are presented as mean ± s.e.m. ** p < 0.01 and ns p > 0.05 as assayed by Mann Whitney test. See also Figure S2.
Figure 3
Figure 3. Selective Targeting of GSC-derived Pericytes Disrupted the BTB Tight Junctions
(A and B) Immunofluorescent analysis of the tight junction markers ZO-1 (A) and Occludin (B) (green) and the endothelial marker CD31 (red) in xenografts derived from T4121 GSCs transduced with DesPro-Vec or DesPro-HsvTK after GCV treatment for 4 days (scale bar, 80µm). (C and D) Statistical quantification of (A) and (B) to determine the ZO-1 (C) and Occludin (D) intensity on vessels. ZO-1 or Occludin intensity was determined by the numbers of ZO-1-positive or Occludin-positive cells normalized to the numbers of CD31-positive cells (n = 5 tumors / group; **, p < 0.01; mean ± s.e.m.; Mann Whitney test). (E) Transmission electron microscopy images of vessels in GBM tumors and matched brain tissues from mice bearing intracranial GBMs derived from T4121 GSCs transduced with DesPro-HsvTK or DesPro-Vec after GCV treatment for 5 days. Red arrows indicate tight junctions between endothelial cells on vessels. Blue arrows indicate the gaps lacking tight junctions between endothelial cells on vessels in tumors after disruption of GSC-derived pericytes. Endothelial cells (EC) were highlighted by red dot lines. Pericytes (PC) were highlighted by green dot lines. No pericyte was detected on vessels in the tumors derived from DesPro-HsvTK-transduced GSCs after GCV treatment (scale bar, 400nm). See also Figures S3 and S4.
Figure 4
Figure 4. Targeting GSC-derived Pericytes Improved Chemotherapy Efficacy for Intracranial GBMs
(A) A schedule of chemotherapy in combination with disruption of GSC-derived pericytes in orthotopic GBM xenografts. GSCs transduced with luciferase and DesPro-HsvTK or DesPro-Vec were implanted into mouse brains. 5 days after GSC implantation, mice were treated with pulse administration of GCV (1mg/20g) for two consecutive days with a two-day interval. Etoposide (60µg/20g) was administered daily. Mice were monitored by bioluminescent imaging and maintained until manifestation of neurological signs. (B) In vivo bioluminescent imaging of intracranial tumor growth in mice bearing GBM xenografts derived from T4121 GSCs transduced with DesPro-HsvTK or DesPro-Vec after treatment with GCV in combination with etoposide or DMSO control. Representative images on day 15 and day 25 post-transplantation of GSCs are shown. (C) Kaplan-Meier survival curves of mice bearing GBMs derived from the GSCs transduced with DesPro-HsvTK or DesPro-Vec and treated with GCV in combination with etoposide or DMSO (n = 5 mice / group; p = 0.0278; two-tailed log-rank test). (D) Immunofluorescent analysis of the apoptotic marker cleaved caspase-3 (red) and the pericyte marker Desmin (green) in xenografts derived from GSCs transduced with DesPro-Vec or DesPro-HsvTK after treatment with GCV plus etoposide or DMSO (scale bar, 80µm). (E) Statistical quantification of (D) shows relative apoptosis in xenografts derived from the GSCs transduced with DesPro-Vec or DesPro-HsvTK after treatment with GCV plus etoposide or DMSO (n = 5 tumors / group; *, p < 0.05; **, p < 0.01; mean ± s.e.m.; Mann Whitney test). See also Figures S5.
Figure 5
Figure 5. BMX Kinase Is Expressed in GSC-derived Neoplastic Pericytes and Is Essential for their Maintenance
(A) Immunofluorescent staining of BMX (green) and α-SMA (red) in human primary GBM tumors and epilepsy brain tissues (scale bar, 40µm). (B) Statistical quantification of (A) shows the percentage of BMX positive staining in α-SMA+ pericytes in GBMs and epilepsy brain tissues (n = 5 sections / group). (C) Immunofluorescent staining of BMX (green) and Desmin (red) in the differentiated cells derived from GSCs. GSCs were cultured in DMEM supplemented with 10% FBS for 5 days to achieve differentiation. BMX signals were detected in the pericyte-like cells (Desmin+) but rarely in other differentiated cells (scale bar, 40µm). (D) Statistical quantification of (C) shows the percentage of BMX-positive staining in Desmin+ pericyte-like cells in vitro in differentiated cells from GSCs (n = 100 cells / group; three independent repeats). (E) Immunofluorescent staining of Desmin (green) and the vascular endothelial cell marker Glut1 (red) in xenografts derived from shNT- or shBMX-transduced GSCs (scale bar, 40µm). (F) Statistical analysis of the pericyte coverage in xenografts derived from the shNT- or shBMX-transduced GSCs (n = 5 tumors / group). Data are presented as mean ± s.e.m. *** p< 0.001, ** p < 0.01, and * p < 0.05 as assayed by Mann Whitney test. See also Figure S6.
Figure 6
Figure 6. Inhibition of BMX by Ibrutinib Disrupted Neoplastic Pericytes and the BTB Tight Junctions to Increase Vascular Permeability in GBMs
(A) Immunofluorescent staining of cleaved caspase-3 (green) and Desmin (red) in xenografts derived from T4121 GSCs after treatment with ibrutinib or DMSO for 3 days (scale bar, 80µm). (B) Statistical quantification of (A) shows relative fraction of apoptotic pericytes in GBM xenografts after treatment with ibrutinib or DMSO. Percentage of apoptotic pericytes was defined by the numbers of pericytes (Desmin+) with cleaved caspase-3 positive staining normalized to the total numbers of pericytes (n = 5 tumors / group). (C) Detection of vascular permeability with the autonomous fluorescent tracer cadaverine (green, 1kDa), and immunofluorescent staining of Desmin (red) and the endothelial marker Glut1 (gray) in xenografts derived from T4121 GSCs after ibrutinib or DMSO treatment for 5 days (scale bar, 40µm). (D) Statistical analysis of the pericyte coverage in xenografts and the adjacent brain tissues from mice treated with ibrutinib or DMSO (n = 5 tumors / group). (E) Statistical analysis of cadaverine effusion in xenografts and the adjacent brain tissues from mice treated with ibrutinib or DMSO (n = 5 tumors / group). (F and G) Immunofluorescent staining of the tight junction markers ZO-1 (F) and Occludin (G) (green) and the endothelial marker CD31 (red) in GSC-derived GBMs and the adjacent brain tissues from mice treated with ibrutinib or DMSO control for 5 days (scale bar, 80µm). (H and I) Statistical quantification to determine the ZO-1 (H) and Occludin (I) signals on vessels in xenografts and the adjacent brain tissues from mice treated with DMSO or ibrutinib (n = 5 tumors / group). Data are presented as mean ± s.e.m. ** p < 0.01, * p < 0.05 and ns p > 0.05 as assayed by Mann Whitney test. See also Figure S6.
Figure 7
Figure 7. Inhibition of BMX by Ibrutinib Improved Efficacy of Chemotherapy with Poor BTB-penetrating Drugs in GBM Xenografts
(A) In vivo bioluminescent imaging of intracranial tumor in mice bearing T4121 GSC-derived GBMs after treatment with etoposide, ibrutinib, ibrutinib plus etoposide, or DMSO control on indicated days after GSC implantation. (B) Kaplan-Meier survival curves of mice bearing GSC-derived xenografts with indicated treatments (n = 5 mice / group; **, p < 0.01; two tailed log-rank test). (C) Immunofluorescent analyses of Desmin (green) and Glut1 (red) in GSC-derived xenografts from mice with indicated treatments (scale bar, 40µm). (D) Statistical quantification of pericyte coverage in GSC-derived xenografts from mice with indicated treatments (n = 5 tumors / group, **, p < 0.01; mean ± s.e.m.; Mann Whitney test). (E) Immunofluorescent staining of cleaved caspase-3 (red) in GSC-derived xenografts from mice with indicated treatments (scale bar, 40µm). (F) Statistical quantification of (E) shows relative apoptosis in GSC-derived xenografts with indicated treatments (n = 5 tumors / group; **, p < 0.01; mean ± s.e.m.; Mann Whitney test). See also Figure S7.

References

    1. Abbott NJ, Ronnback L, Hansson E. Astrocyte-endothelial interactions at the blood-brain barrier. Nat Rev Neurosci. 2006;7:41–53. - PubMed
    1. Aghi M, Cohen KS, Klein RJ, Scadden DT, Chiocca EA. Tumor stromal-derived factor-1 recruits vascular progenitors to mitotic neovasculature, where microenvironment influences their differentiated phenotypes. Cancer Res. 2006;66:9054–9064. - PubMed
    1. Alifrangis C, Agarwal R, Short D, Fisher RA, Sebire NJ, Harvey R, Savage PM, Seckl MJ. EMA/CO for high-risk gestational trophoblastic neoplasia: good outcomes with induction low-dose etoposide-cisplatin and genetic analysis. J Clin Oncol. 2013;31:280–286. - PubMed
    1. Armulik A, Genove G, Betsholtz C. Pericytes: developmental, physiological, and pathological perspectives, problems, and promises. Dev Cell. 2011;21:193–215. - PubMed
    1. Armulik A, Genove G, Mae M, Nisancioglu MH, Wallgard E, Niaudet C, He L, Norlin J, Lindblom P, Strittmatter K, et al. Pericytes regulate the blood-brain barrier. Nature. 2010;468:557–561. - PubMed

MeSH terms