. 2017 Nov 2;21(5):650-664.e8.
doi: 10.1016/j.stem.2017.10.001.

TGF-β-Induced Quiescence Mediates Chemoresistance of Tumor-Propagating Cells in Squamous Cell Carcinoma

Affiliations

TGF-β-Induced Quiescence Mediates Chemoresistance of Tumor-Propagating Cells in Squamous Cell Carcinoma

Jessie A Brown et al. Cell Stem Cell. .

Abstract

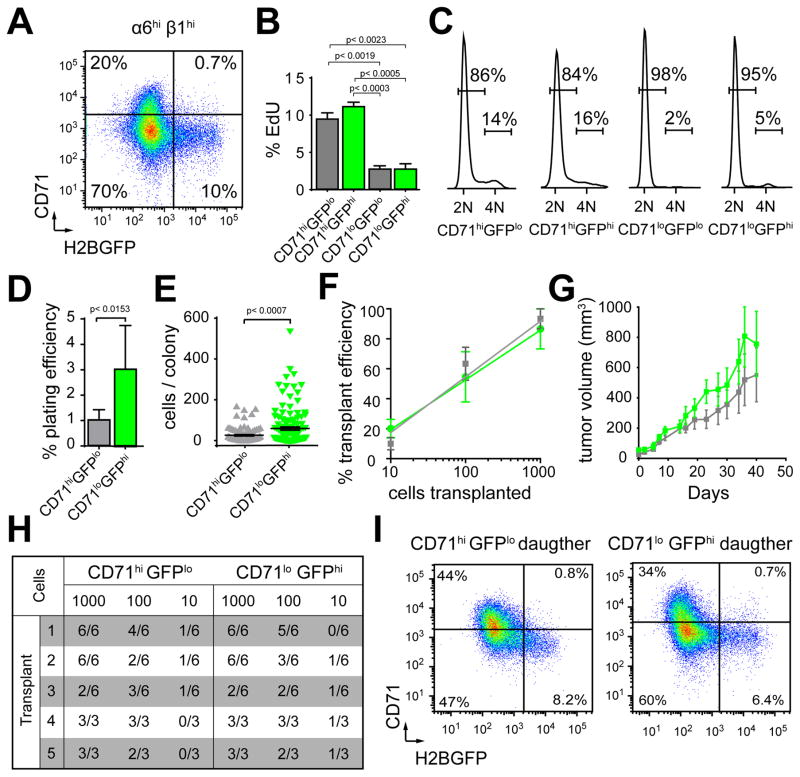
Squamous cell carcinomas (SCCs) are heterogeneous tumors sustained by tumor-propagating cancer cells (TPCs). SCCs frequently resist chemotherapy through still unknown mechanisms. Here, we combine H2B-GFP-based pulse-chasing with cell-surface markers to distinguish quiescent from proliferative TPCs within SCCs. We find that quiescent TPCs resist DNA damage and exhibit increased tumorigenic potential in response to chemotherapy, whereas proliferative TPCs undergo apoptosis. Quiescence is regulated by TGF-β/SMAD signaling, which directly regulates cell-cycle gene transcription to control a reversible G1 cell-cycle arrest, independent of p21CIP function. Indeed, genetic or pharmacological TGF-β inhibition increases the susceptibility of TPCs to chemotherapy because it prevents entry into a quiescent state. These findings provide direct evidence that TPCs can reversibly enter a quiescent, chemoresistant state and thereby underscore the need for combinatorial approaches to improve treatment of chemotherapy-resistant SCCs.

Keywords: TGF-β; cancer stem cells; cell cycle; chemotherapy; quiescence; resistance; skin; squamous cell carcinoma; tumor heterogeneity; tumor propagating cells.


Figures

Figure 1
Figure 1. Label retaining cells reside at the tumor-stroma interface in SCCs
A, Schematic of proliferation reporter. B, Schematic of pulse-chase time course experiment. C, LR SCC cells (green, arrows) emerge at the tumor-stroma interface outlined by α6β4 (red). DAPI (blue) stains nuclei. Scale bars indicate 50μm. D, Flow cytometric analyses of live, RFP+, α6hiβ1hi SCC cells. E, Plating efficiency of LR and non-LR cells. Bar graphs show mean ±s.e.m. (n=7). F, Scatter plots show colony size distribution. Horizontal lines denote mean ±s.e.m. G, Tumor initiating potential in limit dilution transplantation assays. Mean ±s.e.m., (n=6). H, Tumor growth curves of LR and non-LR SCC cells. Points denote mean ±s.e.m., (n=3). See also Figures S1–2.
Figure 2
Figure 2. Quiescent and proliferative SCC cells maintain long-term tumor growth
A, Scatter plot of CD71 and H2BGFP expression. B, 8hr EdU incorporation correlates with CD71. Bar graphs show mean ±s.e.m. (n=3). C, Cell cycle analyses validate proliferation rates of SCC subpopulations. D, Colony formation on 3T3 feeders. Bar graphs show mean ±s.e.m. (n=6, p<0.05, Student’s t-test). E, Scatter plots show colony size distribution. Horizontal lines denote mean ±s.e.m., (p=Mann-Whitney non-parametric t-test). F. Tumor initiating potential in limit dilution transplantation assays. Mean ±s.e.m., (n=5). G, Tumor growth curves starting at the time of tumor detection. Points denote mean ±s.e.m., (n=5). H, Table summarizes limit dilution transplantation assays with 5 serial passages. I, Flow cytometry analyses of live, RFP+, α6hiβ1hi cells following serial transplantation. Scatter plots show similar composition of daughter tumors and their parent (A). See also Figure S2 and Table S1.
Figure 3
Figure 3. Quiescent SCC cells resist cytotoxic therapy
A, Tumor growth curves of vehicle (gray) and 5FU (red) treated SCCs. Points denote mean ±s.e.m., (n=3). B, Luciferase activity measurements indicate physiologically active tumor cells. Scale bar denotes increasing signal intensity from blue to red. C, Scatter plots of vehicle and 5FU treated SCCs. H2BGFP was chased for 10 days. D, Box plots show relative changes in tumor composition after 5FU (red). (n=3). E, Cell cycle profiles of TPC populations after vehicle (gray) or 5FU (red). F, Stacked bar graphs show relative increase of sub-G1 populations in GFPlo cohorts of 5FU treated SCCs. Bar graphs denote mean ±s.e.m. (n=3, p<0.05, Student’s t-test). G, Flow cytometric analyses of Casp3 activation on vehicle (gray) or 5FU (red) treated SCCs. Bar graphs denote mean ±s.e.m. (n=3, p<0.05, Student’s t-test). H, Representative image of γH2AX (red) on vehicle (left) or 5FU (right) treated SCCs. Asterisks denote γH2AX+ apoptotic cells. Arrows denote LR H2BGFPhi (green) cells. β4 (white) outlines the tumor-stroma interface and DAPI (blue) stains nuclei. Scale bar indicates 50μm. I, Dot plots show percentage of γH2AX+ cells in LR and non-LR populations after 5FU (red). J, Kaplan-Meier graphs show tumor initiation potential after transplantation of 100 purified TPCs, isolated from vehicle (left) or 5FU (right) treated SCCs. CD71hiGFPlo cells in gray, CD71hiGFPhi cells in light green, CD71loGFPlo cells in teal and CD71loGFPhi cells in dark green. (n=18, 3 independent experiments with 6 replicates each, p<0.05, Chi square test). See also Figure S3.
Figure 4
Figure 4. Differential gene expression identifies regulators of TPC quiescence in SCC
A, Dendrogram and heat map show differentially expressed transcripts. Blue denotes transcripts upregulated in proliferative (P)-TPCs and red denotes transcripts upregulated in quiescent (Q)-TPCs. B, Venn-Diagram visualizes overlap in transcripts that are upregulated in Q-TPCs, LR-IFSCs, and Q-HFSCs. C, IPA prediction of upstream regulators. z-score denotes pathway activation (positive, red) or inhibition (negative, blue) in Q-TPCs. D–F, qPCR validation of Trp53, Cdkn1a and Tgfbr2 knockdown. Bar graphs show mean fold change. Error bars denote ±s.e.m. (n=3, p<0.05, Student’s t-test). Scatter plots show relative changes in tumor composition. Horizontal lines denote mean ±s.e.m., (p=Mann-Whitney non-parametric t-test). G, Scatter plot analyses of CD71 and H2BGFP in live, RFP+, α6hiβ1hi Tgfbr2wt and Tgfbr2ko SCCs. H, Cell cycle analyses of Tgfbr2wt and Tgfbr2ko SCC cells in vitro before and after 24hr TGFβ1. I, Western blot analyses of SCC cells treated for 0, 1, and 8hr with TGFβ1. See also Figures S4–5 and Tables S2–4.
Figure 5
Figure 5. Chromatin accessible regions bound by Smad2/3 are enriched for cell cycle regulators in quiescent TPCs
A, Schematic representation of integrated ChIP, ATAC, and RNA-seq analyses. B, Global distribution of Smad2/3 bound regulatory elements. C, Venn diagram shows overlap of genes with Smad2/3 bound open chromatin in close proximity and transcripts that are differentially expressed between Q- and P-TPCs. D, Scatter plot visualizes GO data of Smad2/3 regulated genes with transcripts that are differentially expressed between Q- and P-TPCs. Color labels denote statistical significance and circle sizes visualize GO-term frequency (more general terms are larger). E, Bar graphs show differential fold change of Cdc25b expression between Q- and P-TPCs in two independent SCCs. F, Histograms visualizing Smad2/3 binding and chromatin accessibility around the Cdc25b locus in SCC TPCs. G, ChIP-qPCR of Smad2/3 at the Cdc25b enhancer after 1hr TGFβ1 (blue). Bar graphs show mean fold change. Error bars denote ±s.e.m. (n=3, p<0.05, Student’s t-test). H, Histograms show chromatin accessibility at Smad2/3 bound regulatory elements. I, Histograms show genome wide chromatin accessibility at the TSS. J, Enrichment of transcription factor motifs at Smad2/3-bound enhancer sequences. See also Table S5.
Figure 6
Figure 6. Tgfbr2ko tumors are highly responsive to chemotherapy
A, Tumor growth curves of Tgfbr2ko SCCs treated daily with vehicle (gray) or 5FU (red). Points denote mean ±s.e.m. (n=4). B, Luciferase activity measurements indicate physiologically active tumor cells. Arrows indicate de-cellularized plug. Scale bar denotes increasing signal intensity from blue to red. C, Scatter plot analyses of CD71 and H2BGFP in Tgfbr2ko SCCs after vehicle or 5FU. D, Cell cycle profiles after vehicle (gray) or 5FU (red). E, Stacked bar graphs show mean percentage of cells in different stages of the cell cycle in vehicle (gray) and 5FU (red) treated Tgfbr2ko SCCs. F, Colony formation after vehicle (gray) or 5FU (red) on 3T3 feeders. Bar graphs show mean ±s.e.m. (n=3, p<0.05, Student’s t-test). G, Scatter plots show colony size distribution. Horizontal lines denote mean ±s.e.m., (p=Mann-Whitney non-parametric t-test). H, Kaplan-Meier curves show tumor initiating potential after transplantation of 100 purified SCC cells, isolated from vehicle (gray) or 5FU (red) treated tumors (n=18, 3 experiments with 6 replicates each, p<0.05, Chi square test). I, Growth analyses of Tgfbr2wt and Tgfbr2ko SCC cells treated with vehicle or 5FU with or w/o TGFβ1. Bar graphs show mean ±s.e.m. (n=3, p<0.05, Student’s t-test). J, Stacked bar graphs of cell cycle phases of Tgfbr2wt and Tgfbr2ko SCC cells cultured with vehicle or 5FU with or w/o TGFβ1 over time. Bars show mean percentage ±s.e.m. (n=3, p<0.05, Student’s t-test). K, Growth analyses of 5FU treated Tgfbr2wt SCC cells with (red) or w/o (light red) TGFβ1 for 5 days. Cells were released and regrown for 5 days. Bar graphs show mean ±s.e.m. (n=3, p<0.05, Student’s t-test). L, Immunofluorescence microscopy images of γH2AX (red) on Tgfbr2wt SCC cells treated with vehicle or 5FU with or w/o TGFβ1. DAPI (blue) stains nuclei. Box plots of quantifications of γH2AX after 5FU with or w/o TGFβ1. (n=25, p<0.05, Student’s t-test). M, Western blot analyses of Tgfbr2wt and Tgfbr2ko SCC cells treated for 0, 24, and 48hr with 5FU with or w/o TGFβ1. See also Figure S6–7.
Figure 7
Figure 7. TGFβ signaling is activated in HNSCC patients with progressive disease
A, Multi-Dimensional Scaling plot of HPV- HNSCC patients with complete response (blue) or progressive disease (red) after Cisplatin (P), Carboplatin (P) or Paclitaxel (T). B, Volcano plot of differentially expressed genes in responsive and progressive HNSCCs. Red denotes statistically significant transcript changes. C, Venn-Diagram visualizes overlap in transcripts upregulated in Q-TPCs (green), P-TPCs (gray) and patients with progressive HNSCCs (red) or responsive HNSCCs (blue). D, IPA prediction of upstream regulators. z-score indicates pathway activation (positive, red) or inhibition (negative, blue) in patients with progressive disease. E, Stacked bar graphs of cell cycle phases of HNSCC25 cells cultured with vehicle or 5FU with or w/o TGFβ1 in low serum conditions. Bars show mean percentage ±s.e.m. (n=3, p<0.05, Student’s t-test). F, Dose response curves of HNSCC25 cells pretreated for 24hr with DMSO or TGFβ1 before addition of 5FU for 72hr. Fold change was measured by relative luminance units (RLUs). Points denote mean ±s.e.m. (n=3, nonlinear regression). G, Quantification of activity area fold change from dose response assays of HNSCC25 cells in 10, 5, 0.5, and 0.1% serum conditions with or w/o TGFβ1. Bar graphs show mean ±s.e.m. (n=3, p<0.05, Student’s t-test). See also Figure S7 and Table S6.

References

    1. Blanpain C, Lowry WE, Geoghegan A, Polak L, Fuchs E. Self-renewal, multipotency, and the existence of two cell populations within an epithelial stem cell niche. Cell. 2004;118:635–648. - PubMed
    1. Blanpain C, Mohrin M, Sotiropoulou PA, Passegué E. DNA-damage response in tissue-specific and cancer stem cells. Cell Stem Cell. 2011;8:16–29. - PubMed
    1. Bonner JA, Harari PM, Giralt J, Azarnia N, Shin DM, Cohen RB, Jones CU, Sur R, Raben D, Jassem J, et al. Radiotherapy plus cetuximab for squamous-cell carcinoma of the head and neck. N Engl J Med. 2006;354:567–578. - PubMed
    1. Boumahdi S, Driessens G, Lapouge G, Rorive S, Nassar D, Le Mercier M, Delatte B, Caauwe A, Lenglez S, Nkusi E, et al. SOX2 controls tumour initiation and cancer stem-cell functions in squamous-cell carcinoma. Nature. 2014;511:246–250. - PubMed
    1. Bragado P, Estrada Y, Sosa MS, Avivar-Valderas A, Cannan D, Genden E, Teng M, Ranganathan AC, Wen HC, Kapoor A, et al. Analysis of marker-defined HNSCC subpopulations reveals a dynamic regulation of tumor initiating properties. PLoS ONE. 2012;7:e29974. - PMC - PubMed

MeSH terms