. 2017 May 27;8(44):75924-75942.
doi: 10.18632/oncotarget.18237. eCollection 2017 Sep 29.

RECQ1 expression is upregulated in response to DNA damage and in a p53-dependent manner

Affiliations

RECQ1 expression is upregulated in response to DNA damage and in a p53-dependent manner

Swetha Parvathaneni et al. Oncotarget. .

Abstract

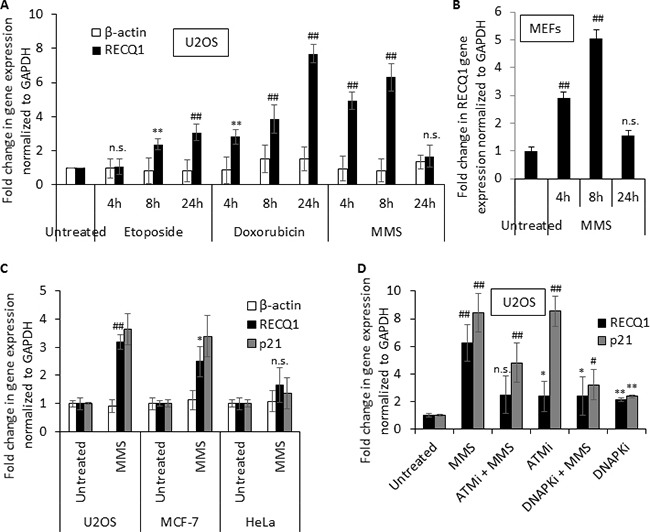
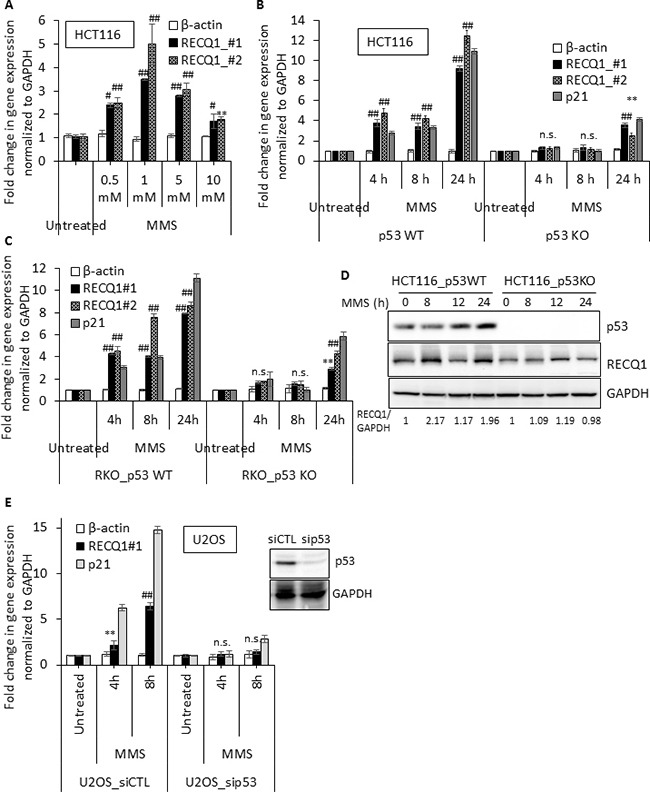
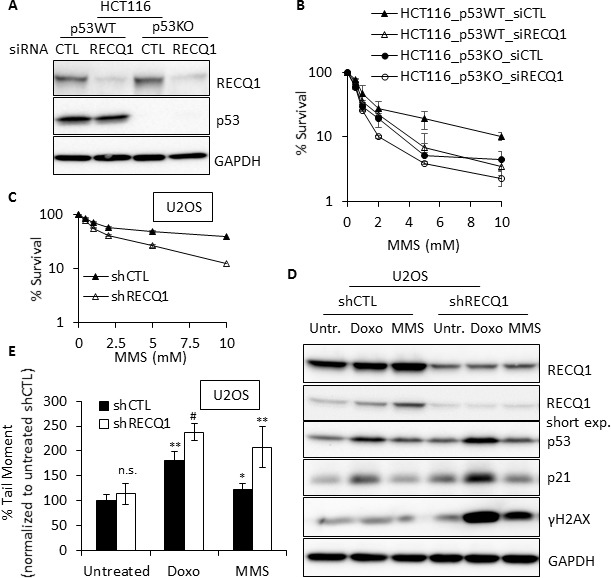
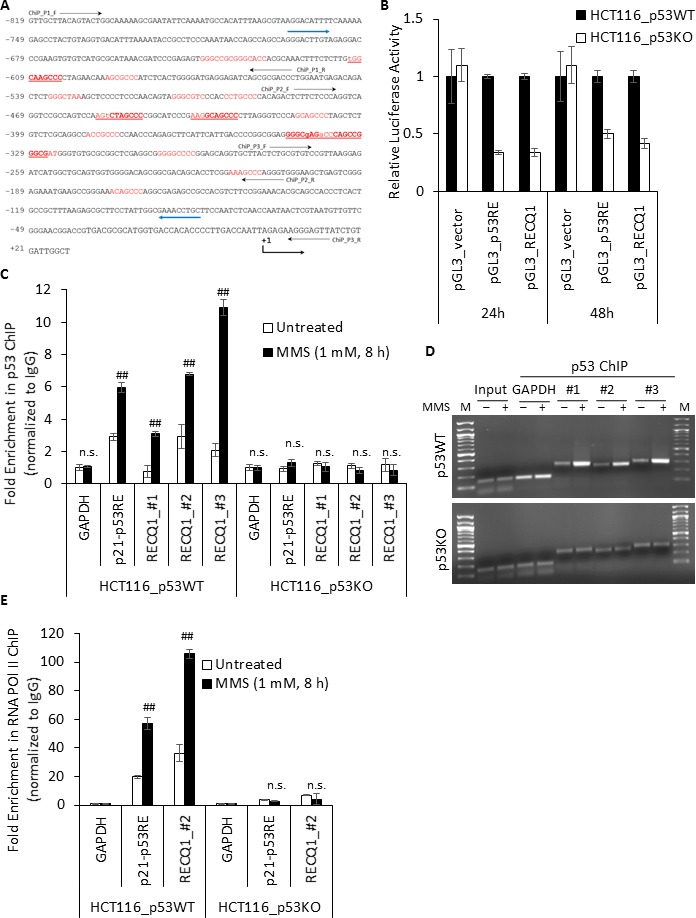
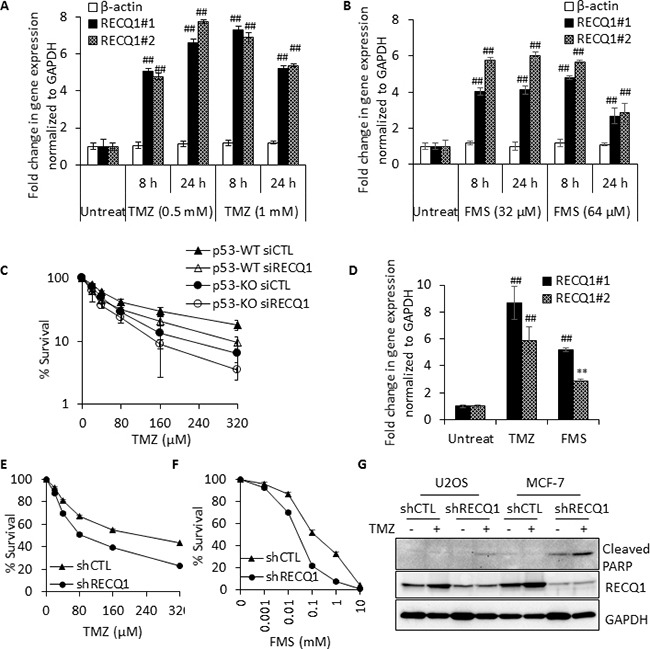
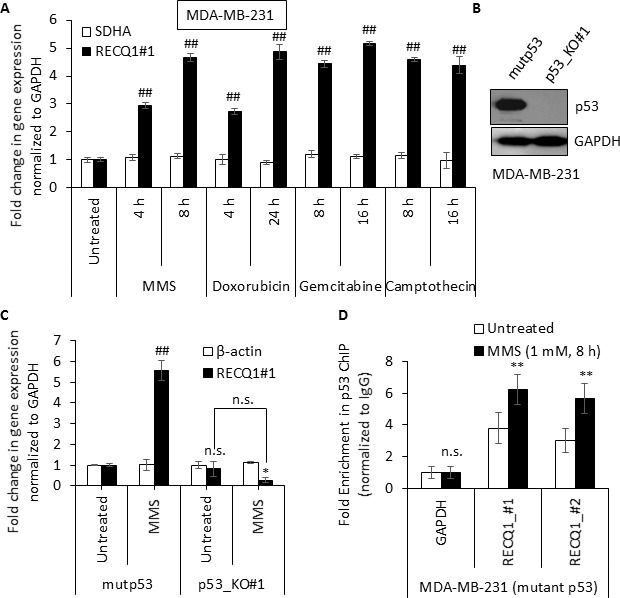
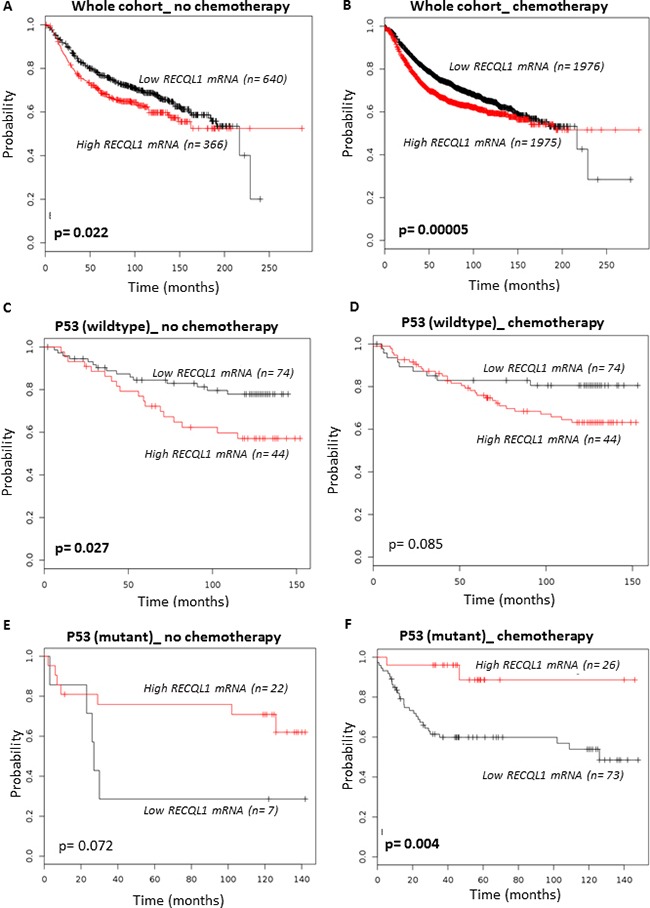
Sensitivity of cancer cells to DNA damaging chemotherapeutics is determined by DNA repair processes. Consequently, cancer cells may upregulate the expression of certain DNA repair genes as a mechanism to promote chemoresistance. Here, we report that RECQ1, a breast cancer susceptibility gene that encodes the most abundant RecQ helicase in humans, is a p53-regulated gene, potentially acting as a defense against DNA damaging agents. We show that RECQ1 mRNA and protein levels are upregulated upon treatment of cancer cells with a variety of DNA damaging agents including the DNA-alkylating agent methylmethanesulfonate (MMS). The MMS-induced upregulation of RECQ1 expression is p53-dependent as it was observed in p53-proficient but not in isogenic p53-deficient cells. The RECQ1 promoter is bound by endogenous p53 and is responsive to p53 in luciferase reporter assays suggesting that RECQ1 is a direct target of p53. Treatment with the chemotherapeutic drugs temozolomide and fotemustine also increased RECQ1 mRNA levels whereas depletion of RECQ1 enhanced cellular sensitivity to these agents. These results identify a previously unrecognized p53-mediated upregulation of RECQ1 expression in response to DNA damage and implicate RECQ1 in the repair of DNA lesions including those induced by alkylating and other chemotherapeutic agents.

Keywords: DNA damage; RecQ; gene expression; helicase; p53.


Conflict of interest statement

CONFLICTS OF INTERESTS The authors do not have any conflicts of interest.

Figures

Figure 1
Figure 1. Genotoxic stress upregulates RECQ1 expression
(A) Summary of quantitative-PCR data on RECQ1 mRNA in U2OS cells that were either untreated or treated with etoposide (1 μM), doxorubicin (500 nM) or MMS (1 mM) for 4, 8 or 24 h. Change in β-actin mRNA was measured as an additional house-keeping control. (B) MMS treatment also upregulates RECQ1 in mouse embryonic fibroblasts (MEFs). (C) MMS induced upregulation of RECQ1 mRNA is not cell line specific and correlates with upregulation of p21, an established p53 target. U2OS, MCF-7, or HeLa cells were untreated or treated with MMS (1 mM) for 4 h. Fold-change in gene expression compared to untreated and normalized to GAPDH is shown. (D) MMS induced upregulation of RECQ1 mRNA in U2OS cells is dependent on activities of ATM and DNA-PK. U2OS cells were untreated or treated with pharmacological inhibitors of ATM (ATMi; 10 μM) or DNA-PK (DNA-PKi; 10 μM) for 16 h prior to treatment with MMS (1 mM, 4 h). Fold-change in gene expression compared to untreated and normalized to GAPDH is shown. Values are average of three independent experiments and standard deviation is indicated by error bars. Statistical significance of RECQ1 expression changes in untreated versus treatment groups is indicated as *p < 0.05; #p < 0.01; **p < 0.005; ##p < 0.001; or n. s., non-significant.
Figure 2
Figure 2. MMS induced upregulation of RECQ1 is p53 dependent
(A) RECQ1 expression is upregulated in response to MMS treatment in HCT116 cells expressing wild-type p53. Cells were either untreated or treated for 4 h with the indicated dose of MMS. Fold-change in gene expression compared to untreated and normalized to GAPDH is shown. Two primer sets (RECQ1 #1, and RECQ1 #2) were used for measuring RECQ1 mRNA. β-actin served as an additional housekeeping control. (B) Isogenic HCT116 cells expressing either the wild-type p53 (p53 WT) or knockout for p53 (p53 KO) were exposed to MMS (1 mM) for indicated time period and the fold-change in mRNA expression of RECQ1 and p21 compared to untreated as measured by qPCR is shown. (C) Fold-change in mRNA expression of RECQ1 and p21 compared to untreated in isogenic p53WT and p53KO RKO cells is shown. (D) Following treatment with MMS (1 mM) for indicated time, expression of RECQ1 and p53 proteins was determined by Western blot analysis of whole-cell extracts. GAPDH was used as a loading control and fold-change in RECQ1 protein expression normalized to GAPDH is indicated. (E) U2OS cells, 42 h after transfection with control siRNA or p53 siRNA, were exposed to MMS (1 mM) for indicated time period and the fold-change in mRNA expression of RECQ1 and p21 compared to untreated cells as measured by qPCR is shown. β-actin served as an additional housekeeping control. Knockdown of p53 protein level is shown by Western Blot. For all the qPCR data, values are average of three independent experiments and standard deviation is indicated by error bars. Statistical significance of RECQ1 expression changes in untreated versus treatment groups is indicated as *p < 0.05; #p < 0.01; **p < 0.005; ##p < 0.001; or n. s., non-significant.
Figure 4
Figure 4. RECQ1 promotes DNA repair and survival after MMS treatment
(A) Western blot showing siRNA knockdown of RECQ1 in p53-proficient and p53-deficient HCT116 cells. (B) RECQ1-depletion and p53 loss have synergistic effect on survival. Following 48 h of siRNA transfection, p53WT and p53KO-HCT116 cells were exposed to MMS for 24 h and subsequently grown for 24 h in drug-free medium. Surviving fraction compared to untreated was determined by cell count. Knockdown of RECQ1 was confirmed by Western blotting as shown. (C) U2OS cells stably transduced with a control (shCTL) or RECQ1 (shRECQ1)-specific shRNA were exposed to MMS for 24 h and subsequently grown for 24 h in drug-free medium. Surviving fraction compared to untreated was determined by cell count. (D) Western blot analysis of whole cell extracts of stable control and RECQ1 knockdown U2OS cells, untreated or treated with doxorubicin (1 μM) or MMS (1 mM) for 4 h. A short exposure of RECQ1 Western blot is also included. (E) DNA double strand breaks in control or RECQ1-depleted cells. Neutral Comet Assay was used to determine tail moment as a measure of double strand breaks in stable control and RECQ1 knockdown U2OS cells, untreated or treated with doxorubicin (1 μM) or MMS (1 mM) for 4 h. Mean tail moment of untreated shCTL was used to normalize the data and is shown as 100%. Statistical significance of difference in tail moment as compared to untreated shCTL is indicated as *p < 0.05; #p < 0.01; **p < 0.005 or n. s., non-significant.
Figure 3
Figure 3. p53 is enriched at the RECQ1 promoter following MMS treatment
(A) Partial sequence of the RECQ1 promoter (−819 bp to +21 bp) is shown with potential p53-binding sites predicted by Promo 3.0.2 indicated in red, those predicted by Tp53 database are underlined, and those predicted by both Promo 3.0.2 and Tp53 are indicated in bold. Transcriptional start site is indicated as +1. The position of primer used for PCR-cloning of a 625 bp fragment from RECQ1 promoter in pGL3-Basic for luciferase assay is indicated by blue arrow. Three primer sets used for ChIP-qPCR analyses of p53 binding are indicated. (B) Dual Luciferase Assay shows p53-dependent transcriptional activation of a 625bp fragment from RECQ1 promoter region; pGL3_p53RE served as a positive control and pGL3_vector as a negative control. The relative luciferase activity was first determined by ratio of firefly and renilla luciferase activity for each sample in p53-WT and p53-KO HCT116 cells, and the relative promoter activity in p53-KO was calculated using the relative luciferase activity from p53-WT cells transfected by each pGL3-basic construct as a reference of 1. Bars indicate mean values plus standard deviation of three independent experiments. (C) MMS-induced enrichment of p53 to RECQ1 promoter. HCT116 cells, p53-WT or p53-KO, untreated or treated with MMS (1 mM, 8 h), were processed for ChIP using a p53-specific antibody. ChIP experiments with rabbit IgG served as negative control. ChIP-qPCR of immunoprecipitated DNA with three probes specific for RECQ1 promoter sequence containing predicted p53 binding sites (#1, #2, and #3, and as shown in A). Binding of p53 to p21 promoter containing p53RE served as a positive control. Fold enrichment over IgG was determined and is shown for each primer pair for the ChIP. Relative occupancy at RECQ1 and p21 promoter sequence versus a negative control site DNA containing GAPDH shows MMS treatment induced enrichment of p53. Statistical significance of enrichment in untreated versus treatment groups is indicated. Results are expressed as means ± SEM for at least three independent experiments. (D) A representative agarose gel of the amplified DNA immunoprecipitated with p53 antibody shows MMS-induced enrichment of p53 to RECQ1 promoter whereas MMS treatment did not change GAPDH abundance in p53 ChIP. M, DNA size marker. (E) Enhanced recruitment of RNA POL II to RECQ1 promoter following MMS treatment. HCT116 cells, p53-WT or p53-KO, untreated or treated with MMS (1 mM, 8 h), were processed for ChIP using a RNA POL II-specific antibody or rabbit IgG. Binding of RNA POL II to RECQ1 promoter sequence and p21 promoter was measured by qPCR of immunoprecipitated DNA. Fold enrichment over IgG was determined and is shown for each primer pair for the ChIP. Relative occupancy at RECQ1 and p21 promoter sequence versus a negative control non-promoter GAPDH sequence shows MMS treatment induced enrichment of RNA POL II. Statistical significance of enrichment in untreated versus treatment groups is indicated. Results are expressed as means ± SEM for at least three independent experiments.
Figure 5
Figure 5. RECQ1 expression is upregulated by the chemotherapeutic drugs that alkylate DNA and positively correlates with cellular resistance to these treatments
(A, B) RECQ1 expression is upregulated in response to Temozolomide (TMZ) or Fotemustine (FMS) treatment of HCT116 cells expressing wild-type p53. RECQ1 mRNA expression was measured using two independent primer sets; fold-change in expression compared to untreated and normalized to GAPDH is shown. β-actin served as an additional housekeeping control. Values are average of three independent experiments and standard deviation is indicated by error bars. Statistical significance of RECQ1 expression changes in untreated versus treatment groups is indicated as *p < 0.05; #p < 0.01; **p < 0.005; ##p < 0.001; or n. s., non-significant. (C) Following 48 h of control or RECQ1 siRNA transfection, p53WT and p53KO-HCT116 cells were exposed to increasing dose of TMZ for 24 h and subsequently grown for 24 h in drug-free medium. Surviving fraction compared to untreated was determined by cell count. Knockdown of RECQ1 was confirmed by Western blotting (not shown). Surviving fraction values are the mean ± SEM from three independent experiments. (D) RECQ1 expression is also upregulated in U2OS cells following treatment with TMZ (1 mM, 6 h) or FMS (32 μM, 6 h). Fold-change in expression compared to untreated and normalized to GAPDH is shown. Values are average of three independent experiments and standard deviation is indicated by error bars. Statistical significance of change in RECQ1 expression compared to untreated is indicated. (E, F) Stable control (shCTL) and RECQ1 knockdown (shRECQ1) U2OS cells were exposed to increasing dose of TMZ or FMS for 24 h and subsequently grown for a further 24 h in drug-free medium. The graphs show the cellular surviving fractions measured at different doses of drug treatment in control and RECQ1-depleted cells. Surviving fraction values are the mean ± SEM from three independent experiments. (G) Whole cell extracts prepared from stable control and RECQ1 knockdown U2OS and MCF7 cells cultured for 5 days in the absence or presence of TMZ (100 μM) were subjected to Western blot analysis of cleaved PARP for apoptosis. Knockdown of RECQ1 was verified by Western blotting. TMZ treatment lead to increase in RECQ1 protein level in both U2OS and MCF7 cells transduced with control shRNA.
Figure 6
Figure 6. DNA damage induced upregulation of RECQ1 expression in MDA-MB-231 cells expressing mutant p53
(A) RNA was isolated from MDA-MB-231 cells that were untreated or treated with MMS (1 mM), doxorubicin (1 μM), gemcitabine (2 μM) or camptothecin (1 μM) as indicated. Fold-change in RECQ1 mRNA expression compared to untreated and normalized to GAPDH is shown. SDHA served as an additional housekeeping control. Values are average of three independent experiments and standard deviation is indicated by error bars. Statistical significance of change in RECQ1 expression compared to untreated is indicated. (B) Western Blots showing loss of p53 protein in TP53 knockout (p53_KO#1) MDA-MB-231 clone and another clone with unchanged level of p53 (mutp53). GAPDH was used as a loading control. (C) Isogenic MDA-MB-231 cells expressing with the mutant p53 (mutp53) or knockout for p53 (p53_KO#1) were exposed to MMS (1 mM) for 8 h and the fold-change in mRNA expression of RECQ1 and β-actin compared to untreated and normalized to GAPDH is shown. Statistical significance of change in RECQ1 expression compared to untreated mup53 is indicated. (D) MMS-induced enrichment of mutant p53 to RECQ1 promoter in MDA-MB-231 cells. MDA-MB-231 cells, untreated or treated with MMS (1 mM, 8 h), were processed for ChIP using a p53-specific antibody. ChIP experiments with rabbit IgG served as negative control. ChIP-qPCR of immunoprecipitated DNA with primers specific for RECQ1 promoter sequence containing predicted p53 binding sites (#1 and #2, as shown in 3A) was performed. Fold enrichment over IgG was determined and is shown for each primer pair for the ChIP. Statistical significance of enrichment in untreated versus treatment groups is presented. Results are expressed as means ± SEM for at least three independent experiments.
Figure 7
Figure 7. Clinical correlation of RECQ1 expression with p53 status for survival outcomes in breast cancer
Kaplan-Meier curves correlating RECQ1 mRNA expression and relapse free survival in breast cancer patients from kmplotter.com are shown. (A, B) Survival of patients, in the whole cohort of 3951 breast tumors, who received no chemotherapy (A) or did receive chemotherapy (B). (C, D) Survival curves for patients with wild-type p53 who received no chemotherapy (C) or received chemotherapy (D). (E, F) Survival curves for patients with mutant p53 who received no chemotherapy (E) or received chemotherapy (F).

Similar articles

Cited by

References

    1. Jackson SP, Helleday T. DNA REPAIR. Drugging DNA repair. Science. 2016;352:1178–79. - PubMed
    1. Roos WP, Thomas AD, Kaina B. DNA damage and the balance between survival and death in cancer biology. Nat Rev Cancer. 2016;16:20–33. - PubMed
    1. Christmann M, Kaina B. Transcriptional regulation of human DNA repair genes following genotoxic stress: trigger mechanisms, inducible responses and genotoxic adaptation. Nucleic Acids Res. 2013;41:8403–20. - PMC - PubMed
    1. Brosh RM., Jr DNA helicases involved in DNA repair and their roles in cancer. Nat Rev Cancer. 2013;13:542–58. - PMC - PubMed
    1. Croteau DL, Popuri V, Opresko PL, Bohr VA. Human RecQ helicases in DNA repair, recombination, and replication. Annu Rev Biochem. 2014;83:519–52. - PMC - PubMed