

Metabolic pathway for the universal fluorescent recognition of tumor cells
- PMID: 29100296
- PMCID: PMC5652690
- DOI: 10.18632/oncotarget.18551
Metabolic pathway for the universal fluorescent recognition of tumor cells
Erratum in
-
Correction: Metabolic pathway for the universal fluorescent recognition of tumor cells.Oncotarget. 2019 Nov 12;10(61):6643. doi: 10.18632/oncotarget.27314. eCollection 2019 Nov 12. Oncotarget. 2019. PMID: 31762944 Free PMC article.
Abstract
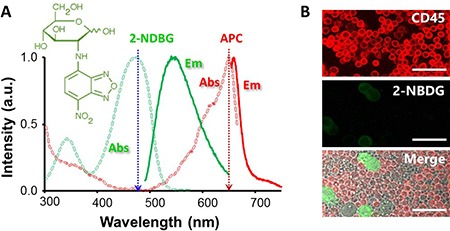
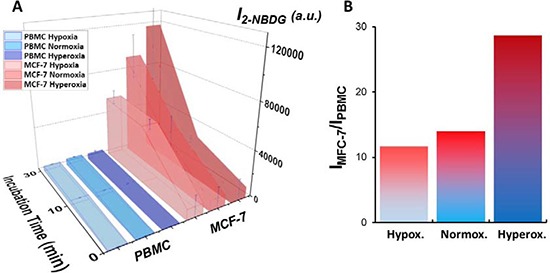
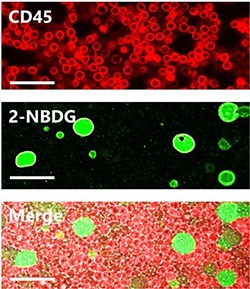
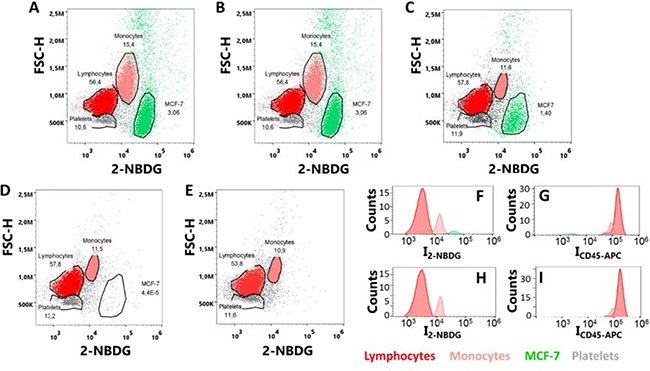
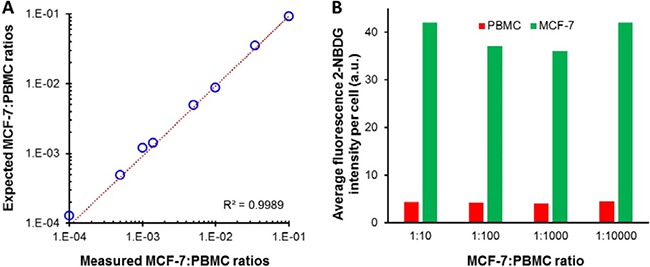
Quantification of circulating tumor cells (CTCs) in blood samples from cancer patients is a non-invasive approach to monitoring the status of the disease. Most of the methods proposed in the recent years are phenomenological and rely on the use of antibodies labelled with fluorophores, magnetic particles, or immobilized on surfaces to capture the CTCs. Herein, we designed and optimized a method that employs a glucose analogue labelled with a fluorophore which takes advantage of the different metabolic pathways of cancer cells to discern them from normal ones. Notably, we demonstrate that fluorescence signal in tumor cells can be greatly maximized by applying hyperoxia conditions without damaging the cells. These results are demonstrated by means of confocal fluorescence and flow-cytometry measurements in peripheral blood mononuclear cells (PBMC) extracted after Ficoll of human blood samples and spiked with a known concentration of MCF-7 tumor cells.
Keywords: breast cancer; circulating tumor cells; glucose uptake; hyperoxia; optical sensing.
Conflict of interest statement
CONFLICTS OF INTEREST The authors declare no potential conflicts of interest.
Figures
Similar articles
-
[Detection and clinical significance of circulating tumor cells in peripheral blood of breast cancer patients].Ai Zheng. 2005 Jul;24(7):837-41. Ai Zheng. 2005. PMID: 16004811 Chinese.
-
Design of a Biocompatible and Ratiometric Fluorescent probe for the Capture, Detection, Release, and Reculture of Rare Number CTCs.Anal Chem. 2018 Nov 20;90(22):13290-13298. doi: 10.1021/acs.analchem.8b02625. Epub 2018 Oct 30. Anal Chem. 2018. PMID: 30345741
-
Detection of tumor-associated cells in cryopreserved peripheral blood mononuclear cell samples for retrospective analysis.J Transl Med. 2016 Jul 2;14(1):198. doi: 10.1186/s12967-016-0953-2. J Transl Med. 2016. PMID: 27369977 Free PMC article.
-
Fluorescence detection and depletion of T47D breast cancer cells from human mononuclear cell-enriched blood preparations by photodynamic treatment: Basic in vitro experiments towards the removal of circulating tumor cells.Lasers Surg Med. 2011 Sep;43(7):548-56. doi: 10.1002/lsm.21089. Lasers Surg Med. 2011. PMID: 22057482
-
Vita-Assay™ Method of Enrichment and Identification of Circulating Cancer Cells/Circulating Tumor Cells (CTCs).Methods Mol Biol. 2016;1406:107-19. doi: 10.1007/978-1-4939-3444-7_9. Methods Mol Biol. 2016. PMID: 26820949
Cited by
-
Surface-Enhanced Raman Spectroscopy in Cancer Diagnosis, Prognosis and Monitoring.Cancers (Basel). 2019 May 29;11(6):748. doi: 10.3390/cancers11060748. Cancers (Basel). 2019. PMID: 31146464 Free PMC article. Review.
-
Adaptive metabolic pattern biomarker for disease monitoring and staging of lung cancer with liquid biopsy.NPJ Precis Oncol. 2018 Aug 8;2:16. doi: 10.1038/s41698-018-0059-9. eCollection 2018. NPJ Precis Oncol. 2018. PMID: 30109276 Free PMC article.
References
-
- Pallaoro A, Hoonejani MR, Braun GB, Meinhart CD, Moskovits M. Rapid Identification by Surface-Enhanced Raman Spectroscopy of Cancer Cells at Low Concentrations Flowing in a Microfluidic Channel. ACS Nano. 2015;9:4328–4336. - PubMed
-
- Alix-Panabieres C, Pantel K. Technologies for detection of circulating tumor cells: facts and vision. Lab Chip. 2014;14:57–62. - PubMed
-
- Grimm D, Bauer J, Pietsch J, Infanger M, Eucker J, Eilles C, Schoenberger J. Diagnostic and therapeutic use of membrane proteins in cancer cells. Curr Med Chem. 2011;18:176–190. - PubMed
LinkOut - more resources
Full Text Sources
Other Literature Sources
