. 2017 Jul 12;8(44):76174-76188.
doi: 10.18632/oncotarget.19192. eCollection 2017 Sep 29.

A tyrosine kinase-STAT5-miR21-PDCD4 regulatory axis in chronic and acute myeloid leukemia cells

Affiliations

A tyrosine kinase-STAT5-miR21-PDCD4 regulatory axis in chronic and acute myeloid leukemia cells

Anne-Sophie Espadinha et al. Oncotarget. .

Abstract

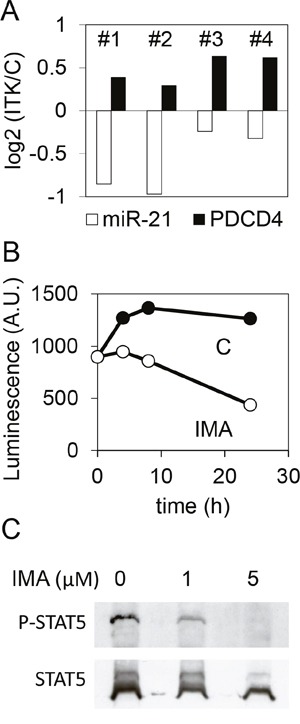
MicroRNAs (miRNAs) are regulators of several key patho-physiological processes, including cell cycle and apoptosis. Using microarray-based miRNA profiling in K562 cells, a model of chronic myeloid leukemia (CML), we found that the oncoprotein BCR-ABL1 regulates the expression of miR-21, an "onco-microRNA", found to be overexpressed in several cancers. This effect relies on the presence of two STAT binding sites on the promoter of miR-21, and on the phosphorylation status of STAT5, a transcription factor activated by the kinase activity of BCR-ABL1. Mir-21 regulates the expression of PDCD4 (programmed cell death protein 4), a tumor suppressor identified through a proteomics approach. The phosphoSTAT5 - miR-21 - PDCD4 pathway was active in CML primary CD34+ cells, but also in acute myeloid leukemia (AML) models like MV4.11 and MOLM13, where the constitutively active tyrosine kinase FLT3-ITD plays a similar role to BCR-ABL1 in the K562 cell line.

Keywords: CML; STAT5; leukemia; miR-21; microRNA.


Conflict of interest statement

CONFLICTS OF INTEREST The authors declare no conflicts of interest

Figures

Figure 1
Figure 1. Regulation of miRNA expression by imatinib in K562 cells
Cells (n=3 independent wells for each sample) were either not treated (C) or treated for 24 h with 1 μM imatinib (IMA) before RNA extraction, labeling and miRNA microarray hybridization. (A) Hierarchical clustering of the 6 independent microRNA expression profiles, revealing a strong molecular signature associated with the treatment. (B) Heatmap of the 13 significantly (p<0.001) dysregulated miRNAs. (C) Significativity (y axe) versus fold change (x axe) plot; the most relevant candidates are depicted.
Figure 2
Figure 2. Quantification of miR-21, miR-21* and pri-miR-21 in K562 cells following imatinib treatment
Cells (n=8-9 independent experiments) were either not treated (C) or treated for 24 h with 1 μM imatinib (IMA) before RNA extraction, reverse transcription and quantification by qPCR of miR-21 (A), miR-21* (B) or pri-miR-21 (C). In (D), cells (n=4 independent experiments) were transfected with a miR-21 sensor plasmid, then treated or not with imatinib. Luciferase activities were measured after 24h. *** P<0.001, * P<0.05 (treated versus not treated cells).
Figure 3
Figure 3. STAT binding sites are necessary for the action of imatinib on miR-21 promoter activity
A 517 bp fragment corresponding to the proximal miR-21 promoter was cloned upstream of a firefly luciferase cds. (A) Relative positions of the STAT/STAT5 putative binding sites identified by Genomatix. (B) K562 cells were transfected with wild-type (WT), deleted or mutated variants of the miR-21 promoter, and treated or not with imatinib (1 μM, 24h) before luciferase activity measurements. For each independent experiment, the normalized luciferase activities of the deleted/mutated variants were compared to the activity of the WT miR-21 promoter. (C) phospho-STAT5 and phospho-STAT3 were detected by western blot of protein extracts from K562 cells not treated or treated with imatinib. ***P<0.001, ** P <0.01 (variant versus WT miR-21 promoter); ### P <0.001 (imatinib-treated versus not treated cells).
Figure 4
Figure 4. Validation and effects of STAT5 knock down on miR-21 expression in K562 cells
Cells were transduced at a MOI of 5 with either STAT5 shRNA or control shRNA lentiviral vector and GFP+ cells were sorted 48h later. (A) The expression of STAT5 was assessed by western blot analysis, confirming the efficacy of the STAT5 shRNA. (B, C) MiR-21 was quantified in the transduced cells either directly by RT-qPCR (B) or indirectly (C) using a reporter “sensor” plasmid driving the transcription of luciferase cds followed by two miR-21 binding sites. (D) The knock-down of STAT5 decreased the miR-21 promoter activity in cells transfected with the miR-21 promoter-luciferase plasmid and abolished the imatinib-induced effect. ***P<0.001, ** P <0.01 (control shRNA versus STAT5 shRNA); # P <0.05 (imatinib-treated versus not treated cells).
Figure 5
Figure 5. Decreased growth rate and increased sensitivity to imatinib induced by miR-21 and STAT5 knock-down
The effects of an anti-miR-21 LNA oligonucleotide (A, B) and of STAT5 shRNA (C, D) were assessed on the growth of K562 (A, C) and on the cells sensitivity to imatinib (B, D). Cells number and viability were measured indirectly by the Cell Titer Glo assay. IC50 are shown between parentheses. Data are mean ± s.e. from a representative experiment done in triplicate.
Figure 6
Figure 6. Regulation of PDCD4 expression by imatinib in K562 cells
(A) The proteome of cells that were not treated (n=2) or treated with imatinib (1 μM, 24h, n=2) was studied using iTRAQ. A total of 1134 proteins were identified and quantified by MS/MS. For each protein (one spot on the graph), the base 2 logarithm of the ratio of its levels in the two samples (IMA/C) is plotted on the y axe. A western blot analysis of PDCD4 expression in control and treated cells confirmed the result observed using proteomics (inset). (B) western blot analysis of PDCD4 expressed in cells transfected by a control LNA, a miR-21 mimic or an anti-miR-21 LNA. (C) western blot analysis of PDCD4 expressed in normal (WT) or miR-21 KO K562 cells (5A, 7B) (D) Luciferase activities of K562 cells co-transfected with (i) plasmids bearing the luciferase coding sequence followed by a 554 bp fragment of the PDCD4 3'UTR containing (WT) or not (Deleted) a miR-21 binding site and (ii) antimiR-21-LNA, miR-21 mimic or control LNA oligonucleotides.
Figure 7
Figure 7. Effect of imatinib on the expression of miR-21 and PDCD4 in CML CD34+ cells
(A) miR-21 and PDCD4 mRNA were quantified by RT-qPCR on CD34+ cells prepared from four CML donors (#1 to 4) and treated (5μM, 24h) or not with imatinib. For each CML donor, histograms represent the base 2 logarithm of the ratio (treated/not treated cells). (B) CD34+ cells from a CML donor were transduced with a lentivirus carrying a firefly luciferase coding sequence cloned downstream of the miR-21 promoter, then treated or not treated with imatinib. Luciferase activity was measured after 4, 8 or 24 hours. (C) phospho-STAT5 and STAT5 were detected by western blot of protein extracts from CML CD34+ not treated or treated with imatinib.
Figure 8
Figure 8. Effect of TKI treatment on the expression of miR-21 and PDCD4 in AML cells lines
(A) MV4.11 and MOLM13 cells were treated with sunitinib (0.1μM, 24h). Then, PDCD4 mRNA and miR-21 were quantified by RT-qPCR (A), and miR-21 promoter activity was assessed by luciferase measurements in cells transduced with the miR-21 promoter-Luciferase lentivirus. (B) For each cell line, histograms represent the base 2 logarithm of the ratio (treated/not treated cells). (C) phospho-STAT5 levels were assessed in control (-) or TKI-treated (+) MV4.11 (left) and MOLM13 (right) cells. (D) Luciferase activity was measured in MOLM13 cells 24 hours after transfection with pGL4.10 plasmids having no promoter, WT or mutated miR-21 promoters.

References

    1. Ren R. Mechanisms of BCR-ABL in the pathogenesis of chronic myelogenous leukaemia. Nat Rev Cancer. 2005;5:172–83. doi: 10.1038/nrc1567. - DOI - PubMed
    1. Chakraborty C, Sharma AR, Patra BC, Bhattacharya M, Sharma G, Lee SS. MicroRNAs mediated regulation of MAPK signaling pathways in chronic myeloid leukemia. Oncotarget. 2016;7:42683–97. doi: 10.18632/oncotarget.7977. - DOI - PMC - PubMed
    1. Wang LS, Li L, Li L, Chu S, Shiang KD, Li M, Sun HY, Xu J, Xiao FJ, Sun G, Rossi JJ, Ho Y, Bhatia R. MicroRNA-486 regulates normal erythropoiesis and enhances growth and modulates drug response in CML progenitors. Blood. 2015;125:1302–13. doi: 10.1182/blood-2014-06-581926. - DOI - PMC - PubMed
    1. Jacquel A, Herrant M, Legros L, Belhacene N, Luciano F, Pages G, Hofman P, Auberger P. Imatinib induces mitochondria-dependent apoptosis of the Bcr-Abl-positive K562 cell line and its differentiation toward the erythroid lineage. FASEB J Off Publ Fed Am Soc Exp Biol. 2003;17:2160–2. doi: 10.1096/fj.03-0322. - DOI - PubMed
    1. Rasmussen KD, Simmini S, Abreu-Goodger C, Bartonicek N, Di Giacomo M, Bilbao-Cortes D, Horos R, Von Lindern M, Enright AJ, O’Carroll D. The miR-144/451 locus is required for erythroid homeostasis. J Exp Med. 2010;207:1351–8. doi: 10.1084/jem.20100458. - DOI - PMC - PubMed