

Cancer cell line specific co-factors modulate the FOXM1 cistrome
- PMID: 29100329
- PMCID: PMC5652723
- DOI: 10.18632/oncotarget.20405
Cancer cell line specific co-factors modulate the FOXM1 cistrome
Abstract
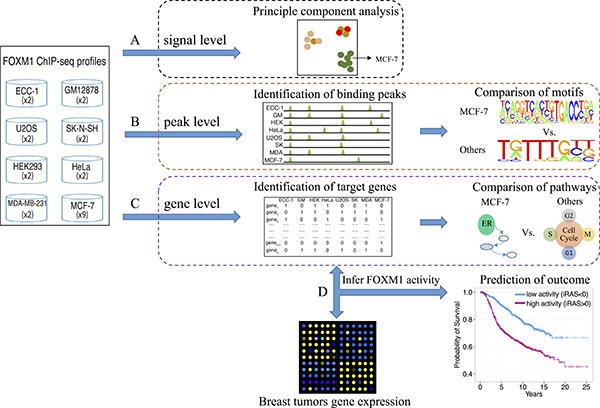
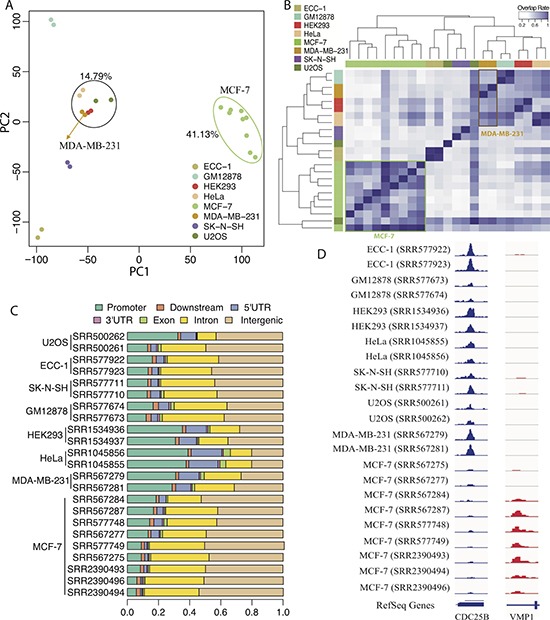
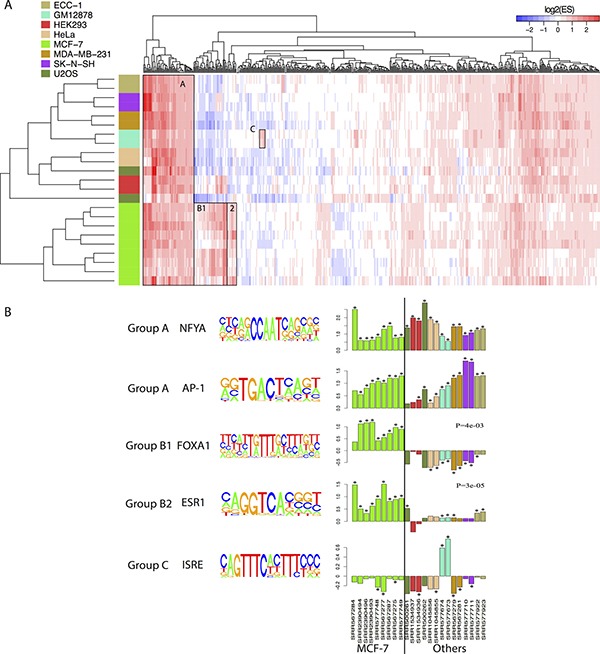
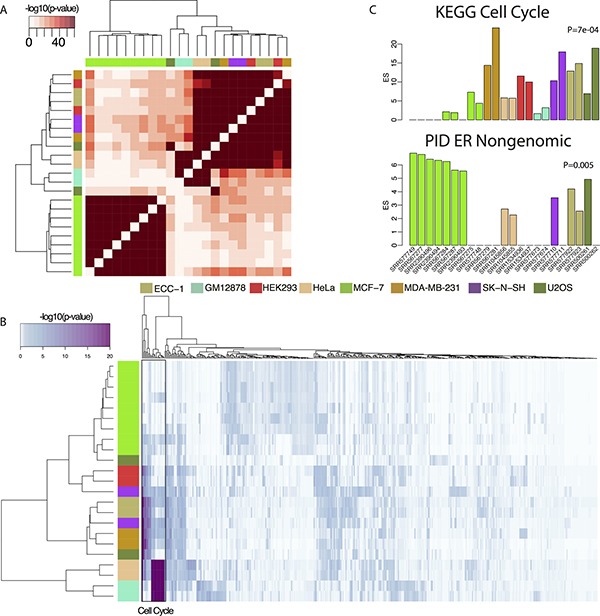
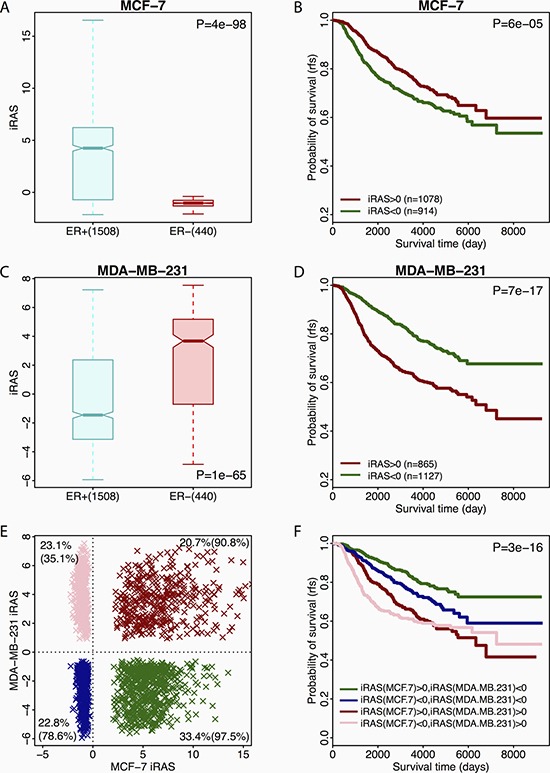
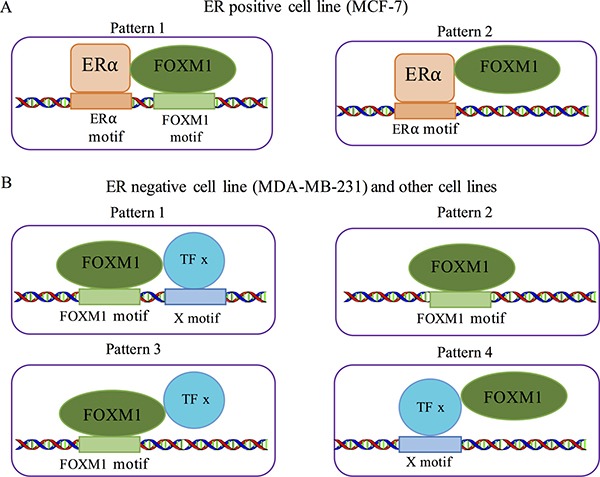
ChIP-seq has been commonly applied to identify genomic occupation of transcription factors (TFs) in a context-specific manner. It is generally assumed that a TF should have similar binding patterns in cells from the same or closely related tissues. Surprisingly, this assumption has not been carefully examined. To this end, we systematically compared the genomic binding of the cell cycle regulator FOXM1 in eight cell lines from seven different human tissues at binding signal, peaks and target genes levels. We found that FOXM1 binding in ER-positive breast cancer cell line MCF-7 are distinct comparing to those in not only other non-breast cell lines, but also MDA-MB-231, ER-negative breast cancer cell line. However, binding sites in MDA-MB-231 and non-breast cell lines were highly consistent. The recruitment of estrogen receptor alpha (ERα) caused the unique FOXM1 binding patterns in MCF-7. Moreover, the activity of FOXM1 in MCF-7 reflects the regulatory functions of ERα, while in MDA-MB-231 and non-breast cell lines, FOXM1 activities regulate cell proliferation. Our results suggest that tissue similarity, in some specific contexts, does not hold precedence over TF-cofactors interactions in determining transcriptional states and that the genomic binding of a TF can be dramatically affected by a particular co-factor under certain conditions.
Keywords: ChIP-seq; FOXM1 reprogramming; breast cancer prognosis; genomic binding; transcription factor.
Conflict of interest statement
CONFLICTS OF INTEREST The authors declare that they have no competing interests.
Figures
Similar articles
-
Predicting FOXM1-Mediated Gene Regulation through the Analysis of Genome-Wide FOXM1 Binding Sites in MCF-7, K562, SK-N-SH, GM12878 and ECC-1 Cell Lines.Int J Mol Sci. 2020 Aug 26;21(17):6141. doi: 10.3390/ijms21176141. Int J Mol Sci. 2020. PMID: 32858881 Free PMC article.
-
FOXM1 cistrome predicts breast cancer metastatic outcome better than FOXM1 expression levels or tumor proliferation index.Breast Cancer Res Treat. 2015 Nov;154(1):23-32. doi: 10.1007/s10549-015-3589-7. Epub 2015 Oct 12. Breast Cancer Res Treat. 2015. PMID: 26456572
-
Effects of triptolide from Tripterygium wilfordii on ERalpha and p53 expression in two human breast cancer cell lines.Phytomedicine. 2009 Nov;16(11):1006-13. doi: 10.1016/j.phymed.2009.03.021. Epub 2009 Jun 12. Phytomedicine. 2009. PMID: 19524422
-
FoxM1 down-regulation leads to inhibition of proliferation, migration and invasion of breast cancer cells through the modulation of extra-cellular matrix degrading factors.Breast Cancer Res Treat. 2010 Jul;122(2):337-46. doi: 10.1007/s10549-009-0572-1. Epub 2009 Oct 8. Breast Cancer Res Treat. 2010. Retraction in: Breast Cancer Res Treat. 2016 Aug;158(3):607. doi: 10.1007/s10549-016-3904-y. PMID: 19813088 Retracted.
-
Transcriptional regulation of vascular endothelial growth factor by estradiol and tamoxifen in breast cancer cells: a complex interplay between estrogen receptors alpha and beta.Cancer Res. 2002 Sep 1;62(17):4977-84. Cancer Res. 2002. PMID: 12208749
Cited by
-
FOXM1 cooperates with ERα to regulate functional β-cell mass.Am J Physiol Endocrinol Metab. 2025 Jun 1;328(6):E804-E821. doi: 10.1152/ajpendo.00438.2024. Epub 2025 Apr 22. Am J Physiol Endocrinol Metab. 2025. PMID: 40261794 Free PMC article.
-
CDI Exerts Anti-Tumor Effects by Blocking the FoxM1-DNA Interaction.Biomedicines. 2022 Jul 11;10(7):1671. doi: 10.3390/biomedicines10071671. Biomedicines. 2022. PMID: 35884976 Free PMC article.
-
Blast cells surviving acute myeloid leukemia induction therapy are in cycle with a signature of FOXM1 activity.BMC Cancer. 2021 Oct 28;21(1):1153. doi: 10.1186/s12885-021-08839-9. BMC Cancer. 2021. PMID: 34711181 Free PMC article.
-
Regulator combinations identify systemic sclerosis patients with more severe disease.JCI Insight. 2020 Sep 3;5(17):e137567. doi: 10.1172/jci.insight.137567. JCI Insight. 2020. PMID: 32721949 Free PMC article.
-
Predicting FOXM1-Mediated Gene Regulation through the Analysis of Genome-Wide FOXM1 Binding Sites in MCF-7, K562, SK-N-SH, GM12878 and ECC-1 Cell Lines.Int J Mol Sci. 2020 Aug 26;21(17):6141. doi: 10.3390/ijms21176141. Int J Mol Sci. 2020. PMID: 32858881 Free PMC article.
References
-
- Robertson G, Hirst M, Bainbridge M, Bilenky M, Zhao Y, Zeng T, Euskirchen G, Bernier B, Varhol R, Delaney A, Thiessen N, Griffith OL, He A, et al. Genome-wide profiles of STAT1 DNA association using chromatin immunoprecipitation and massively parallel sequencing. Nat Methods. 2007;4:651–7. https://doi.org/10.1038/nmeth1068. - DOI - PubMed
-
- Buck MJ, Lieb JD. ChIP-chip: considerations for the design, analysis, and application of genome-wide chromatin immunoprecipitation experiments. Genomics. 2004;83:349–60. - PubMed
-
- Park PJ. ChIP-seq: advantages and challenges of a maturing technology. Nat Rev Genet. 2009;10:669–80. https://doi.org/10.1038/nrg2641. - DOI - PMC - PubMed
-
- Johnson DS, Mortazavi A, Myers RM, Wold B. Genome-wide mapping of in vivo protein-DNA interactions. Science. 2007;316:1497–502. https://doi.org/10.1126/science.1141319. - DOI - PubMed
-
- Sandmann T, Jakobsen JS, Furlong EE. ChIP-on-chip protocol for genome-wide analysis of transcription factor binding in Drosophila melanogaster embryos. Nat Protoc. 2006;1:2839–55. https://doi.org/10.1038/nprot.2006.383. - DOI - PubMed
Grants and funding
LinkOut - more resources
Full Text Sources
Other Literature Sources
Miscellaneous
