. 2017 Aug 18;8(44):77028-77040.
doi: 10.18632/oncotarget.20332. eCollection 2017 Sep 29.

Plasma exosome miR-196a and miR-1246 are potential indicators of localized pancreatic cancer

Affiliations

Plasma exosome miR-196a and miR-1246 are potential indicators of localized pancreatic cancer

Yi-Fan Xu et al. Oncotarget. .

Abstract

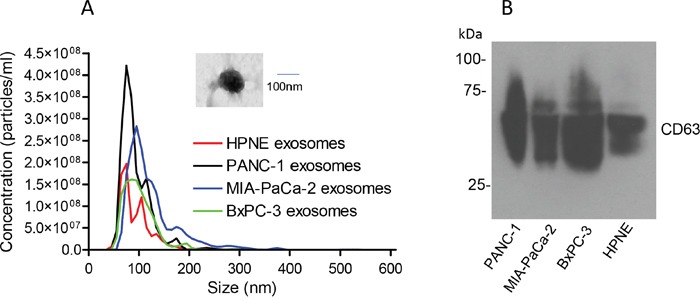
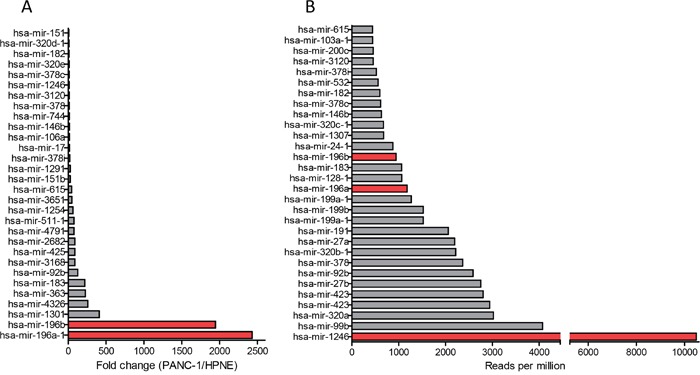
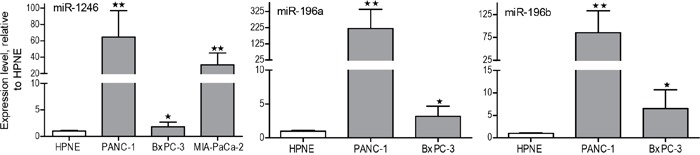
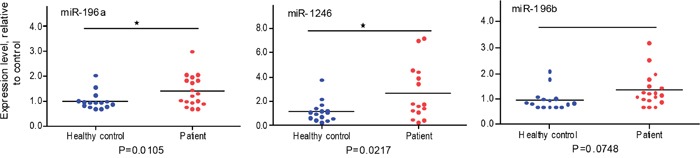
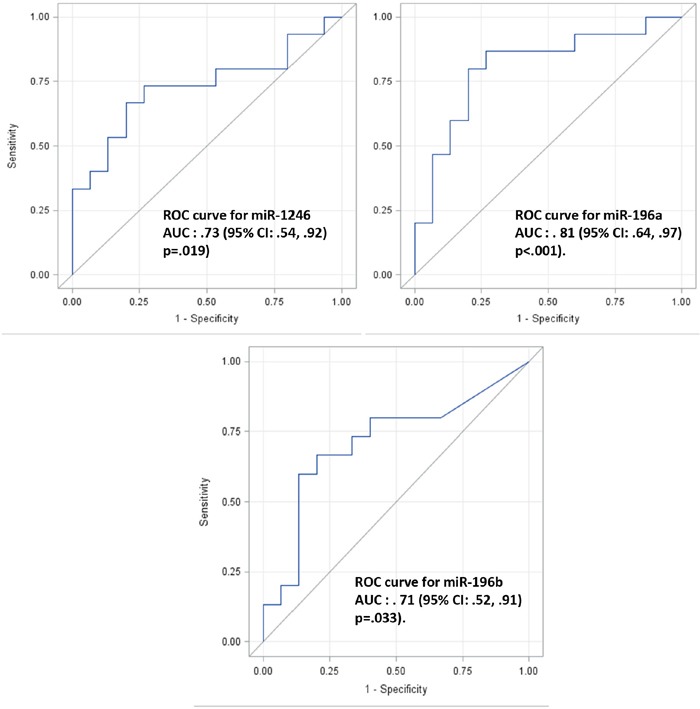
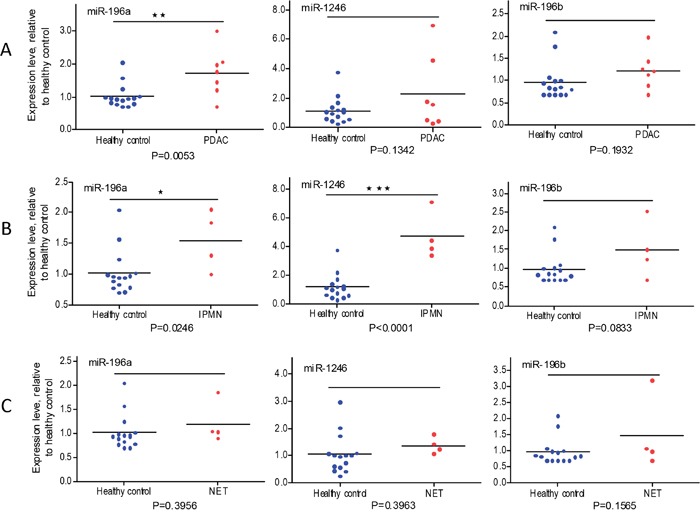
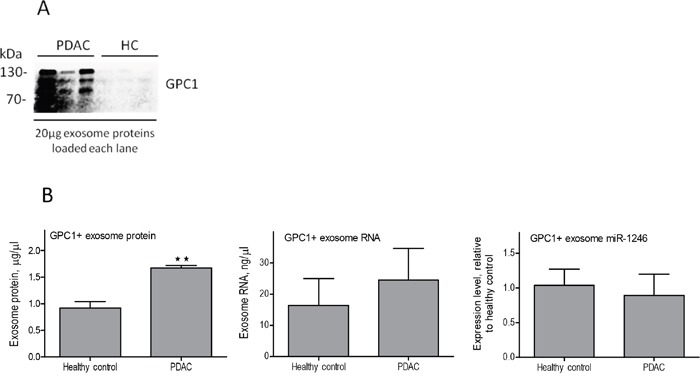
Patients with localized pancreatic cancer (stage I and stage IIA) have a much higher survival rate than those presenting at later stages, yet early detection remains a challenge to this malignancy. The aim of this study was to evaluate whether exosome miRNA signatures are indicative of localized pancreatic cancer. Exosomes were collected from the conditioned media of pancreatic cancer cell lines and plasma samples of localized pancreatic cancer patients (Stage I-IIA, n=15), and healthy subjects (n=15). Cellular and exosome miRNAs from pancreatic cancer cell lines were profiled by next-generation small RNA sequencing. Plasma exosome miRNA expression was analyzed by qRT-PCR. We found that certain miRNAs, such as miR-196a and miR-1246, are highly enriched in pancreatic cancer exosomes. Consistently, plasma exosome miR-196a and miR-1246 levels were significantly elevated in pancreatic cancer patients as compared to healthy subjects. An analysis of the cancer subtypes indicated that plasma exosome miR-196a is a better indicator of pancreatic ductal adenocarcinoma (PDAC), whereas plasma exosome miR-1246 is significantly elevated in patients with intraductal papillary mucinous neoplasms (IPMN). In contrast, there were no differences in the plasma exosome miR-196a and miR-1246 levels between patients with pancreatic neuroendocrine tumors (NET) and healthy subjects. In conclusion, we demonstrate that certain miRNA species, such as miR-196a and miR-1246, are highly enriched in pancreatic cancer exosomes and elevated in plasma exosomes of patients with localized pancreatic cancer.

Keywords: early detection; exosome; microRNAs; pancreatic cancer; plasma biomarkers.


Conflict of interest statement

CONFLICTS OF INTEREST There are no conflicts to disclose.

Figures

Figure 1
Figure 1. Characterization of exosomes isolated from pancreatic cancer cell lines
Exosomes were isolated from the conditioned media of PANC-1, MIA-PaCa-2, BxPC-3 and hTERT-HPNE cells. (A) Nanoparticle tracking analysis of 50X diluted exosomes (n=3). Inset shows an exosome image observed under EM (30,000x). (B) Western blot of CD63 (30-75 kDa) under non-reducing conditions.
Figure 2
Figure 2. Selectively expressed and highly enriched miRNAs in pancreatic cancer exosomes
Cellular and exosome RNA was isolated from hTERT-HPNE and PANC-1 cells. microRNA expression was analyzed using Small RNA next generation sequencing (n=3). (A) Top 30 miRNAs highly expressed in PANC-1 exosomes compared to hTERT-HPNE exosomes (fold of changes). (B) Top 30 miRNAs highly abundant in PANC-1 exosomes (reads per million).
Figure 3
Figure 3. qRT-PCR analysis of miR-1246, miR-196a and miR-196b expression in PANC-1, MIA-PaCa-2, and BxPC-3 exosomes versus hTERT-HPNE exosomes
Total RNA was extracted from the exosomes and miR-196a, miR196b and miR-1246 expression was measured by qRT-PCR. Fold-change in expression is shown for miR-1246, miR-196a and miR-196b relative to their levels in hTERT-HPNE exosomes and normalized to the spike-in cel-miR-54 control (n=3, means ± SEM). *p<0.05; **p<0.01; Student's t-test.
Figure 4
Figure 4. qRT-PCR analysis of plasma exosome miRNA expression in normal and pancreatic cancer patients
Plasma samples were collected from healthy subjects without a history of cancer (n=15) and patients with localized pancreatic cancer (n=15; see Table 2). The Exoquick reagent was used to isolate exosomes from plasma samples. Total RNA was extracted from the plasma exosomes and miR-196a, miR196b and miR-1246 expression was measured by qRT-PCR. Cel-miR-54 was spiked-in to serve as experimental control. Data are expressed as relative expression levels. *p<0.05, Student's t-test.
Figure 5
Figure 5. ROC analysis of microRNA expression in normal and pancreatic cancer patient plasma exosomes
Receiver Operator Characteristic (ROC) curves were constructed using each microRNA expression value for miR-1246 (top left), miR-196a (top right) and miR-196b (low) respectively. The average of triplicate expression values was computed for individual patient sample and microRNA. The Area Under the Curve (AUC) with 95% CI were computed and shown for each ROC curve. The Wilcoxon-Mann-Whitney test was used to test the null hypothesis that the AUC is equal to .5 (i.e., no predictive power) and the P values for each test were shown.
Figure 6
Figure 6. qRT-PCR analysis of plasma exosome miRNA expression in PADC, IPMN and NET patients relative to healthy subjects
Expression of miR-1246, miR-196a and miR-196b was analyzed using plasma exosomes from PDAC patients (A, n=7), IPMN patients (B, n=4), NET patients (C, n=4), and healthy subjects (n=15). Cel-miR-54 was spiked-in to serve as experimental control. Data are expressed as relative expression levels. *p<0.05; **p<0.01; ***p<0.001; Student's t-test.
Figure 7
Figure 7. miR-1246 expression in GPC1 positive plasma exosomes
Total plasma exosomes from three patients with localized pancreatic cancer and three healthy controls were subjected to immunoaffinity isolation using the GPC1 antibody complexed magnetic beads. Exosome protein and RNA were extracted from the antibody-beads complexes using TRIzol reagent. (A) Western blot analysis of the immunoaffinity isolated exosomes from patients (PDAC) and healthy controls (HC), using an antibody against GPC1 (equal amount of exosome protein was loaded in each lane). Note that GPC1 was detected at significantly higher levels in PDAC GPC1 positive exosomes (bands range from 70-130 kDa). (B) Protein concentrations in GPC1 positive plasma exosomes (left), **p<0.01, Student's t-test; RNA concentrations in GPC1 positive plasma exosomes (center), and miR-1246 expression in GPC1 positive plasma exosomes (right, n=3, means ± SEM).

Similar articles

Cited by

References

    1. Siegel RL, Miller KD, Jemal A. Cancer statistics, 2016. CA Cancer J Clin. 2016;66:7–30. - PubMed
    1. NATIONAL CANCER INSTITUTE-SEER. Stat Fact Sheets: Pancreas Cancer. http://seer.cancer.gov/statfacts/html/pancreas.html Accessed on 8 March, 2017.
    1. NATIONAL CANCER. INSTITUTE--SEER Stat Fact Sheets: All Cancer Sites. http://seer.cancer.gov/statfacts/html/all.html Accessed on 8 March, 2017.
    1. Hanada K, Okazaki A, Hirano N, Izumi Y, Minami T, Ikemoto J, Kanemitsu K, Hino F. Effective screening for early diagnosis of pancreatic cancer. Best practice & research Clinical gastroenterology. 2015;29:929–939. - PubMed
    1. Donahue TR, Dawson DW. Leveraging Mechanisms Governing Pancreatic Tumorigenesis To Reduce Pancreatic Cancer Mortality. Trends in endocrinology and metabolism. TEM. 2016;27:770–781. - PMC - PubMed