. 2017 Aug 24;8(44):77292-77308.
doi: 10.18632/oncotarget.20467. eCollection 2017 Sep 29.

Metabolic modulation of Ewing sarcoma cells inhibits tumor growth and stem cell properties

Affiliations

Metabolic modulation of Ewing sarcoma cells inhibits tumor growth and stem cell properties

Atreyi Dasgupta et al. Oncotarget. .

Abstract

Ewing sarcoma (EWS) is a highly aggressive and metabolically active malignant tumor. Metabolic activity can broadly be characterized by features of glycolytic activity and oxidative phosphorylation. We have further characterized metabolic features of EWS cells to identify potential therapeutic targets. EWS cells had significantly more glycolytic activity compared to their non-malignant counterparts. Thus, metabolic inhibitors of glycolysis such as 2-deoxy-D-glucose (2DG) and of the mitochondrial respiratory pathway, such as metformin, were evaluated as potential therapeutic agents against a panel of EWS cell lines in vitro. Results indicate that 2DG alone or in combination with metformin was effective at inducing cell death in EWS cell lines. The predominant mechanism of cell death appears to be through stimulating apoptosis leading into necrosis with concomitant activation of AMPK-α. Furthermore, we demonstrate that the use of metabolic modulators can target putative EWS stem cells, both in vitro and in vivo, and potentially overcome chemotherapeutic resistance in EWS. Based on these data, clinical strategies using drugs targeting tumor cell metabolism present a viable therapeutic modality against EWS.

Keywords: 2DG; Ewing sarcoma; cancer stem cells; metabolism; metformin.


Conflict of interest statement

CONFLICTS OF INTEREST The authors declare no competing financial interest.

Figures

Figure 1
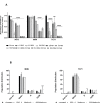
Figure 1. Metabolic profile of Ewing's sarcoma cells
(A) ECAR rate was measured for EWS (A673, MHH, and TC71) and NM cells (hFOBS and IMR-90) in real-time using the Seahorse extracellular flux analyzer. A series of extracellular acidification rates (ECAR) were calculated showing basal glycolytic activity (orange block) and the maximum glycolytic capacity (green block). A, B, and C indicates injection of glucose, oligomycin and 2DG respectively. (B) OCR/ECAR ratio indicating dependence of cells on either mitochondrial respiration or glycolysis. Absolute values were obtained by seeding 30,000 cells/well. (C) Media at different time points from wells with 2×10⁴ cells were collected to determine extracellular lactate level, lactate measurements showed significant increase at 72 hours compared to the NM cells. *p <0.05 was regarded as significant and calculated by comparing the means of the two groups with unpaired t test. Data represents the mean of three wells ± standard deviation.
Figure 2
Figure 2. Targeting energy pathway by metabolic inhibition
(A) Schematic showing the two main pathways of glucose metabolism. (B) Effect of metabolic inhibition on lactate formation. Media after no treatment and 24 hours treatment with 2DG (2.5 mM) or metformin (5 mM) or a combination, was collected from wells with 2×10⁴ cells to determine extracellular lactate level. Lactate measurements are shown as fold change over untreated control. (C) Effect of 2DG and Metformin on cell viability. EWS cells were treated for 3 days with varying concentrations of 2DG or metformin, alone or in combination. CellTiter-Glo was added and viability was measured at 72 hours. The results are expressed as relative fraction of viability compared with the corresponding untreated control group. Other than the indicated non-significant statistical difference (ns) all other treatment groups compared to the corresponding control was significantly different with p <0.0001. (D) Ewing sarcoma cells were treated for 3 days with 5 mM of 2DG, and 10 mM of metformin as single agents or in combination. Number of cells after treatment was quantified in situ with an image cytometer (Celigo). Data shown are means ± SD of 3 determinations. (E) PDX38 cell line, established from a EWS patient was used to see effect of metabolic inhibition on cell viability. Cells were treated for 3 days with indicated concentrations of 2DG and Metformin, alone or in combination. CellTiter-Glo was added and viability was measured at 72 hours. The results are expressed as relative fraction viability compared with the corresponding untreated control group. (F) Non-malignant cells, hFOBS and IMR-90 were treated for 3 days with indicated concentrations of 2DG, or metformin alone or in combination. (G) 2DG and metformin effects are independent of hypoxia. Cells were grown under normoxic conditions with 20% O2 or under 1% hypoxia for three days. Cells were left untreated or treated with either 2DG (5 mM), or metformin (10 mM) as single agents or in combination. Number of cells after treatment was quantified with in situ with an image cytometer (Celigo). (H) EWS cells either grown under normal culture condition with 25 mM glucose, or under glucose starved condition, were treated with 5 mM 2DG and 10 mM metformin either alone or in combination. Number of cells after treatment was quantified with in situ with an image cytometer (Celigo). Statistical significance of p <0.05 was calculated with two-way Anova with Dunnett's multiple correction (* <0.05, ** <0.01, *** <0.001, **** <0.0001) with ns indicating non-significant. All data, unless otherwise indicated had p <0.0001 by Dunnett's multiple comparison test, when compared to corresponding control.
Figure 3
Figure 3. Metabolic inhibition induces apoptosis
(A) Caspase-3 activity was measured using lysates from untreated cells or cells treated with 2DG and/or metformin as described under Materials and Methods. Purified caspase-3 was used as positive control. Results show fold change over corresponding untreated control. (B) Flow cytometry analysis showing percentage of cells undergoing apoptosis and necrosis in untreated, 2DG (2.5 mM), metformin (5 mM) or metformin and 2DG treated cells. Cells stained only with Propidium iodide (PI) were gated as dead cells and Annexin V-positive cells were gated as apoptotic cells. Necrotic cells were quantified as both Annexin V and PI positive population, using a FACS analyzer. (C) Flow cytometry analysis showing induction of apoptosis in a time dependent manner when treated with 2.5 mM 2DG in MHH cells. Data shown are means ± SEM (n = 3).
Figure 4
Figure 4. 2DG and metformin can modulate cell proliferation and cell cycle
(A) EWS cells, untreated or treated for 3 days with 2.5 mM 2DG, 5 mM metformin, or a combination of the two were quantified for proliferative cells by BrdU incorporation. (B) Cell cycle analysis by FACS of EWS cells treated with 2DG or metformin or a combination of both. Cells were treated for 72 h followed by staining with propidium iodide (PI). DNA content was quantified by flow cytometry. Analysis was done using FlowJo software with Dean-Jen Fox statistical model. Data is represented as the percentage of cells in the sub-G1, G0/G1, S and G2/M phase of the cell cycle. For each sample 10,000 cells were acquired. Data shown are means ± SEM. Pairwise comparisons of control to treated groups individually using Dunnett's multiple comparison test is shown in the figure (p = * <0.05, ** <0.01, *** <0.001, **** <0.0001).
Figure 5
Figure 5. 2DG and metformin can modulate Ewing sarcoma stem cell subpopulation cells
(A) Sphere formation assay of MHH and TC71 cells. Sphere-forming ability of cells were greatly reduced in cells treated for 72 hours with 2.5 mM 2DG, or 5 mM metformin, or a combination of both, compared to untreated control. (B) Quantification of spheres determined with the help of Image ProPremiere (Media Cybernetics) software. Values represent the mean ± SD of triplicate. (C) Differences in diameter of spheres left untreated or treated for 72 hours with 2.5 mM 2DG, or 5 mM metformin, or a combination of both. Pairwise comparisons of control to treated groups individually using Dunnett's multiple comparison test is shown in the figure (p * <0.05, ** <0.01, *** <0.001, **** <0.0001). (D) Graphical representation of flow cytometry analysis using an Aldefluor assay kit showing ALDH(high) activity. Experiment was set up according to the manufacturer's protocol as described in Materials and Methods. DEAB was used as an inhibitor of ALDH(high) activity. Data shown are means ± SEM (n = 3). (E) Gene expression profile for stem cell markers. Cells were treated for 3 days with 2.5 mM 2DG, or 5 mM metformin, or a combination of both. Gene expression profile representing stem cell markers was done from extracted RNA and compared to untreated control.
Figure 6
Figure 6. Pre-treatment with 2DG alone or in combination with metformin can delay tumor latency
Untreated cells or cells pre-treated with either 2DG (2.5 mM), metformin (5 mM), or combination for 72 hours were harvested and 50,000 cells were injected in the left tibia of 5 mice in each group. (A) Graph showing tumor latency in mice. Each dot represents one mouse reporting a palpable tumor at the site of injection at indicated time points. (B) Graph showing number of metastatic nodules in liver from each mouse estimated by gross observation. Each dot represents one mouse with number of nodules in the Y-axis. No tumor or no metastasis indicates mice that had either no palpable tumor or no liver metastasis respectively. All statistical comparison was done pair-wise by comparing control group to each of the treated group using one-way Anova, with no multiple correction. NS indicates no significant difference, while p <0.05 was considered statistically significant and indicated with a *, and p = <0.01 with **.
Figure 7
Figure 7. 2DG can enhance chemosensitivity
MHH cells were treated for 0-96 hours and viability was measured at indicated time points. (A) Cells were either untreated or treated with 2DG or Doxorubicin alone or in combination. (B) Cells were either left untreated or treated with 2DG or BMN alone or in combination. Data was normalized to cell viability reading from day 0. (C) PARP-i resistant cells are sensitive to 2DG mediated inhibition. Parental (A673) and the PARP inhibitor, BMN 673 (Talazoparib) resistant (A673-BMN) A673 cells were treated for 3 days with varying concentrations of 2DG. CellTiter-Glo was added and viability was measured at 72 hours. The results are expressed as relative fraction viability compared with the corresponding untreated control group. Data shown are means ± SD of 4 determinations. Pairwise comparisons using one-way Anova with Dunnett's multiple comparison test is shown in the figure (p * <0.05, ** <0.01, *** <0.001, **** <0.0001). Comparison of control to treated groups individually are indicated in asterisk with corresponding color while comparison between two treated groups are shown in black.

References

    1. Riggi N, Stamenkovic I. The biology of Ewing sarcoma. Cancer Lett. 2007;254:1–10. - PubMed
    1. Lau YS, Adamopoulos IE, Sabokbar A, Giele H, Gibbons CL, Athanasou NA. Cellular and humoral mechanisms of osteoclast formation in Ewing's sarcoma. Br J Cancer. 2007;96:1716–1722. - PMC - PubMed
    1. Balamuth NJ, Womer RB. Ewing's sarcoma. Lancet Oncol. 2010;11:184–192. - PubMed
    1. Karski EE, Matthay KK, Neuhaus JM, Goldsby RE, Dubois SG. Characteristics and outcomes of patients with Ewing sarcoma over 40 years of age at diagnosis. Cancer Epidemiol. 2013;37:29–33. - PMC - PubMed
    1. Esiashvili N, Goodman M, Marcus RB., Jr Changes in incidence and survival of Ewing sarcoma patients over the past 3 decades: surveillance epidemiology and end results data. J Pediatr Hemat Oncol. 2008;30:425–430. - PubMed

LinkOut - more resources