. 2017 Sep 6;8(44):77595-77608.
doi: 10.18632/oncotarget.20668. eCollection 2017 Sep 29.

Gene-body hypermethylation controlled cryptic promoter and miR26A1-dependent EZH2 regulation of TET1 gene activity in chronic lymphocytic leukemia

Affiliations

Gene-body hypermethylation controlled cryptic promoter and miR26A1-dependent EZH2 regulation of TET1 gene activity in chronic lymphocytic leukemia

Pradeep Kumar Kopparapu et al. Oncotarget. .

Abstract

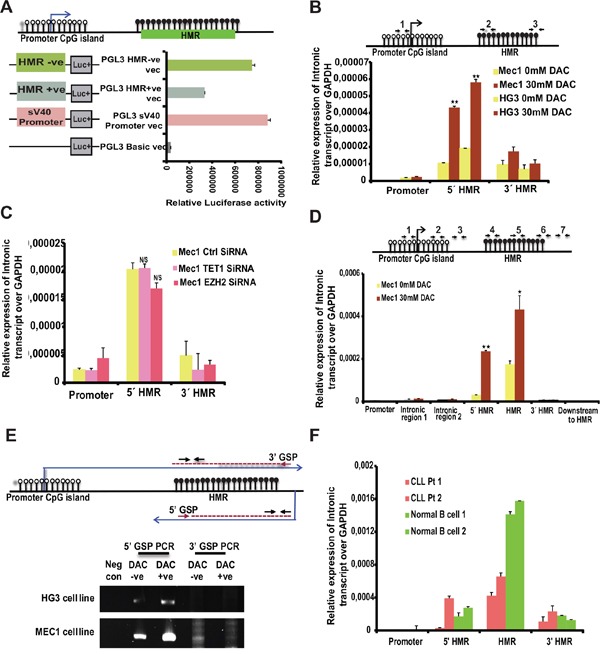
The Ten-eleven-translocation 1 (TET1) protein is a member of dioxygenase protein family that catalyzes the oxidation of 5-methylcytosine to 5-hydroxymethylcytosine. TET1 is differentially expressed in many cancers, including leukemia. However, very little is known about mechanism behind TET1 deregulation. Previously, by characterizing global methylation patterns in CLL patients using MBD-seq, we found TET1 as one of the differentially methylated regions with gene-body hypermethylation. Herein, we characterize mechanisms that control TET1 gene activity at the transcriptional level. We show that treatment of CLL cell lines with 5-aza 2´-deoxycytidine (DAC) results in the activation of miR26A1, which causes decrease in both mRNA and protein levels of EZH2, which in turn results in the decreased occupancy of EZH2 over the TET1 promoter and consequently the loss of TET1 expression. In addition, DAC treatment also leads to the activation of antisense transcription overlapping the TET1 gene from a cryptic promoter, located in the hypermethylated intronic region. Increased expression of intronic transcripts correlates with decreased TET1 promoter activity through the loss of RNA Pol II occupancy. Thus, our data demonstrate that TET1 gene activation in CLL depends on miR26A1 regulated EZH2 binding at the TET1 promoter and silencing of novel cryptic promoter by gene-body hypermethylation.

Keywords: EZH2 and TET1 gene; chronic lymphocytic leukemia; cryptic promoters; gene-body hypermethylation.


Conflict of interest statement

CONFLICTS OF INTEREST The authors have no conflicts of interest.

Figures

Figure 1
Figure 1. DNA methylation status and TET1 expression levels in CLL samples and normal B cell controls
(A) The illustration represents the methylated peaks enriched regions from IGHV-unmutated and IGHV-mutated CLL samples compared to normal B cell control sample with a p value <0.00001 located between exon1 and exon2 of TET1 gene based on MDB sequencing data. (B) Schematic model illustrating the unmethylated CpG sites at promoter region (represented by white-filled lollipops), black-filled lollipops representing methylated CpG sites on gene body intronic region and location of pyrosequencing primer sets used for analyzing DNA methylation status. Below is the box plot showing the percentage of DNA methylation on TET1 promoter and gene body hypermethylated region between CLL samples and normal B cell samples assessed by pyrosequencing. (C) Box plot showing the differential expression of TET1 analyzed based on independent published RNA sequencing data on 96 CLL patient samples [23]. (D) Box plots showing the expression of TET1 in CLL patient samples (n= 40) compared to the normal B cell samples (n=5) using RT-qPCR analysis.
Figure 2
Figure 2. Expression of TET1 and EZH2 after DNA methyl inhibitor treatment and effect of miR26A1 overexpression
(A) Relative mRNA expression levels of TET1 gene over GAPDH in both DNA methylation inhibitor (DAC) treated and untreated CLL cell lines (HG3 & MEC1) and MCL cell lines (GRANTA 519 & Z138). (B) Relative expression levels of TET1 and EZH2 over GAPDH in increasing concentrations of DAC treated HG3 and MEC1 cell lines. (C) Western blot analysis showing protein levels of TET1 and EZH2 in DAC treated and untreated CLL cell line samples. (D) Fold change mRNA expression levels of TET1 and EZH2 over GAPDH in miR26A1 and miR26A1 inhibitor overexpressed CLL cell line samples. The p value significance is indicated as stars compared to control samples (*P < 0.05, **P < 0.005 and NS, not significant).
Figure 3
Figure 3. EZH2 dependent expression of TET1
(A) Snapshot of UCSC genome browser in different cell lines from the ENCODE/Broad institute datasets, showing EZH2 binding peaks at TET1 promoter region. (B) Relative expression levels of TET1 and EZH2 over GAPDH in EZH2 siRNA and control siRNA transfected four leukemic cell lines. (C) Western blot analysis showing the protein levels of EZH2 and TET1 in control siRNA and EZH2 siRNA transfected HG3 and MEC1 samples. (D) Fold change expression levels of TET1 and EZH2 over GAPDH in EZH2 downregulated GRANTA 519 and Z138 MCL cell lines, using both siRNA transfections and EZH2 inhibitor (3-Deazaneplanocin) treatment assay (ranging from 0uM to 15uM) respectively. The p value significance is indicated as stars compared to control samples (*P < 0.05, **P < 0.005 and N/S, not significant). (E) ChIP assay showing the fold enrichment of EZH2, H3K27me3 and H2K27ac occupancy at TET1 promoter using DAC treated and untreated MEC1 cell line.
Figure 4
Figure 4. Promoter activity of HMR and presence of intronic transcripts within the TET1 gene
(A) The promoter activity of different PGL3 cloned vectors (as shown in the schematic diagram on left side of the graph) transfected in MCF-7 cell line analyzed using Dual luciferase reporter assay. HMR +ve and -ve indicates positive and negative orientation of the sequence cloned with respect to Luciferase gene. (B) Upper panel depicts the model illustrating the TET1 promoter unmethylated CpG island (represented by white-filled lollipops) and HMR (represented by black filled lollipops) showing the location of three different primer sets (1, 2, and 3) used for below intronic transcript RT-qPCR. Below are the graphs showing the relative expression levels of intronic transcripts over GAPDH on the specified locations of TET1 gene for DAC treated untreated CLL cell line samples. (C) Relative expression levels of intronic transcript over GAPDH as mentioned above using EZH2 and TET1 siRNA samples compared to control siRNA transfected CLL cell line samples. (D) Graph showing the relative expression levels of intronic transcripts in MEC1 DAC treated and untreated samples using 7 different primer sets located between TET1 peak region and promoter region of TET1 gene. The location of these primer sets on TET1 gene is indicated in the above illustrated diagram with numbers (1 to 7). (E) Detection of anti-sense intronic transcript of TET1 gene using Reverse Transcription PCR. 5’ Gene specific primer (GSP) and 3’GSP are designed for specifically synthesizing cDNA from lower anti-sense strand and upper sense strand respectively. Lanes 1 to 5 shows the PCR amplified products from 5’GSP and 3’GSP cDNA synthesis using DAC treated and untreated CLL cell line samples (upper panel shows HG3 samples and lower panel shows MEC1 samples). The negative control indicates the sample with cDNA synthesized without any GSP primer. The location of GSP primers and the primer sets used for amplification after cDNA synthesis are indicated in the above illustrated schematic diagram. (F) Relative expression levels of intronic transcript over GAPDH using two CLL samples and two normal B cell samples at TET1 gene promoter and HMR regions.
Figure 5
Figure 5. Analyzing the RNA Pol II occupancy and promoter activity at cryptic promoter region of TET1 gene
(A) Fold enrichment of RNA pol II occupancy at TET1 promoter and cryptic promoter region (mapped to downstream of HMR) along with HMR on TET1 gene. The location of the ChIP primer sets (1 to 3) used for this assay is illustrated in the above diagram. (B) The promoter activity of different PGL3 cloned vectors (as shown in the schematic diagram on left side of the graph) transfected in MCF-7 cell line analyzed using dual luciferase reporter assay. The 519 bp predicted cryptic promoter region cloned for luciferase activity (green color bar) is shown in the schematic illustration above the graph.
Figure 6
Figure 6. A model explaining the role of DNA hypermethylation in regulating TET1 gene expression
The upper panel represents the expression status of TET1 gene in CLL samples in vivo. The white and black filled lollipops represents unmethylated and methylated CpG sites on TET1 promoter CpG island and HMR CpG island in intronic region respectively. Each lollipop indicates one CpG site. The while colored rectangular boxes indicates exons. miR26A1, EZH2 and RNA Pol II are shown in colored circles with arrows up and down indicating higher and lower levels respectively. The above panel shows the representation of TET1 expression before DAC treatment and the below arrow shows the representation of TET1 after DAC treatment. In the upper panel, TET1 gene is active and shown with open arrow. In the lower panel TET1 gene is inactive and shown with closed arrow. The red color arrow in the anti-sense direction in the lower panel represents cryptic transcript. In the HMR of lower panel, few CpG sites methylated and few unmethylated depicting that this region is less methylated compared to above completely hypermethylated region.

Similar articles

Cited by

References

    1. Shen L, Song CX, He C, Zhang Y. Mechanism and function of oxidative reversal of DNA and RNA methylation. Annu Rev Biochem. 2014;83:585–614. - PMC - PubMed
    1. Han JA, An J, Ko M. Functions of TET proteins in hematopoietic transformation. Mol Cells. 2015;38:925–935. - PMC - PubMed
    1. Hashimoto H, Liu Y, Upadhyay AK, Chang Y, Howerton SB, Vertino PM, Zhang X, Cheng X. Recognition and potential mechanisms for replication and erasure of cytosine hydroxymethylation. Nucleic Acids Res. 2012;40:4841–4849. - PMC - PubMed
    1. Tan L, Shi YG. Tet family proteins and 5-hydroxymethylcytosine in development and disease. Development. 2012;139:1895–1902. - PMC - PubMed
    1. Langemeijer SM, Kuiper RP, Berends M, Knops R, Aslanyan MG, Massop M, Stevens-Linders E, van Hoogen P, van Kessel AG, Raymakers RA, Kamping EJ, Verhoef GE, Verburgh E, et al. Acquired mutations in TET2 are common in myelodysplastic syndromes. Nat Genet. 2009;41:838–842. - PubMed

LinkOut - more resources