Contribution of GABAa, GABAc and glycine receptors to rat dark-adapted oscillatory potentials in the time and frequency domain
- PMID: 29100418
- PMCID: PMC5652335
- DOI: 10.18632/oncotarget.20770
Contribution of GABAa, GABAc and glycine receptors to rat dark-adapted oscillatory potentials in the time and frequency domain
Abstract
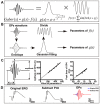
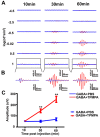
Retinal oscillatory potentials (OPs) consist of a series of relatively high-frequency rhythmic wavelets, superimposed onto the ascending phase of the b-wave of the electroretinogram (ERG). However, the origin of OPs is uncertain and methods of measurement of OPs are diverse. In this study, we first isolated OPs from the rat ERG and fitted them with Gabor functions and found that the envelope of the OP contained information about maximum amplitude and time-to-peak to enable satisfactory quantification of the later OPs. And the OP/b-wave ratio should be evaluated to exclude an effect of the b-wave on the OPs. Next, we recorded OPs after intravitreal injection of 2-amino-4-phosphonobutyric acid (APB), tetrodotoxin (TTX), γ-aminobutyric acid (GABA), strychnine (STR), SR95531 (SR), isoguvacine (ISO), (1,2,5,6-tetrahydropyridin-4-yl) methylphosphinic acid (TPMPA) and GABA+TPMPA. We showed that GABA and APB only removed the later OPs, when compared to control eyes. TTX delayed the peak time, and STR, SR and ISO reduced the amplitude of OPs. TPMPA delayed the peak time but increased the ratio of OPs to b-wave. Furthermore, administration of combined GABA and TPMPA caused the later OPs to increase in amplitude with time, compared with those after delivery of GABA alone. Finally, we observed that GABAc and glycine receptors contributed to a low-frequency component of the OPs, while GABAa contributed to both components. These results suggest that the early components of the OPs are mainly generated by the photoreceptors, whilst the later components are mainly regulated by GABAa, GABAc and glycine receptors.
Keywords: GABA receptors; frequency domain; glycine receptors; oscillatory potentials.
Conflict of interest statement
CONFLICTS OF INTEREST The authors indicate no potential conflicts of interest.
Figures


Similar articles
-
Modulation of the components of the rat dark-adapted electroretinogram by the three subtypes of GABA receptors.Vis Neurosci. 2003 Sep-Oct;20(5):535-42. doi: 10.1017/s0952523803205071. Vis Neurosci. 2003. PMID: 14977332
-
Origin of Retinal Oscillatory Potentials in the Mouse, a Tool to Specifically Locate Retinal Damage.Int J Mol Sci. 2023 Feb 4;24(4):3126. doi: 10.3390/ijms24043126. Int J Mol Sci. 2023. PMID: 36834538 Free PMC article.
-
Supernormal ERG oscillatory potentials in transgenic rabbit with rhodopsin P347L mutation and retinal degeneration.Invest Ophthalmol Vis Sci. 2009 Sep;50(9):4402-9. doi: 10.1167/iovs.09-3458. Epub 2009 Apr 30. Invest Ophthalmol Vis Sci. 2009. PMID: 19407007
-
Antagonists of ionotropic gamma-aminobutyric acid receptors impair the NiCl2-mediated stimulation of the electroretinogram b-wave amplitude from the isolated superfused vertebrate retina.Acta Ophthalmol. 2009 Nov;87(8):854-65. doi: 10.1111/j.1755-3768.2008.01387.x. Acta Ophthalmol. 2009. PMID: 20002018
-
[Animal models of human retinal and optic nerve diseases analysed using electroretinography].Nippon Ganka Gakkai Zasshi. 2010 Mar;114(3):248-78, discussion 279. Nippon Ganka Gakkai Zasshi. 2010. PMID: 20387538 Review. Japanese.
Cited by
-
Increase in electroretinogram rod-driven peak frequency of oscillatory potentials and dark-adapted responses in a cohort of myopia patients.Doc Ophthalmol. 2020 Apr;140(2):189-199. doi: 10.1007/s10633-019-09732-4. Epub 2019 Oct 28. Doc Ophthalmol. 2020. PMID: 31659575
-
Dysregulated CD200-CD200R signaling in early diabetes modulates microglia-mediated retinopathy.Proc Natl Acad Sci U S A. 2023 Nov 7;120(45):e2308214120. doi: 10.1073/pnas.2308214120. Epub 2023 Oct 30. Proc Natl Acad Sci U S A. 2023. PMID: 37903272 Free PMC article.
-
Nfia Is Critical for AII Amacrine Cell Production: Selective Bipolar Cell Dependencies and Diminished ERG.J Neurosci. 2023 Dec 6;43(49):8367-8384. doi: 10.1523/JNEUROSCI.1099-23.2023. J Neurosci. 2023. PMID: 37775301 Free PMC article.
-
Rescue of Retinal Degeneration in rd1 Mice by Intravitreally Injected Metformin.Front Mol Neurosci. 2019 Apr 26;12:102. doi: 10.3389/fnmol.2019.00102. eCollection 2019. Front Mol Neurosci. 2019. PMID: 31080404 Free PMC article.
-
Functional optical coherence tomography enables in vivo optoretinography of photoreceptor dysfunction due to retinal degeneration.Biomed Opt Express. 2020 Aug 27;11(9):5306-5320. doi: 10.1364/BOE.399334. eCollection 2020 Sep 1. Biomed Opt Express. 2020. PMID: 33014616 Free PMC article.
References
LinkOut - more resources
Full Text Sources
Other Literature Sources
Research Materials
Miscellaneous

