. 2018 Jan 15;433(2):357-373.
doi: 10.1016/j.ydbio.2017.08.030. Epub 2017 Oct 31.

Cellular, ultrastructural and molecular analyses of epidermal cell development in the planarian Schmidtea mediterranea

Affiliations

Cellular, ultrastructural and molecular analyses of epidermal cell development in the planarian Schmidtea mediterranea

Li-Chun Cheng et al. Dev Biol. .

Abstract

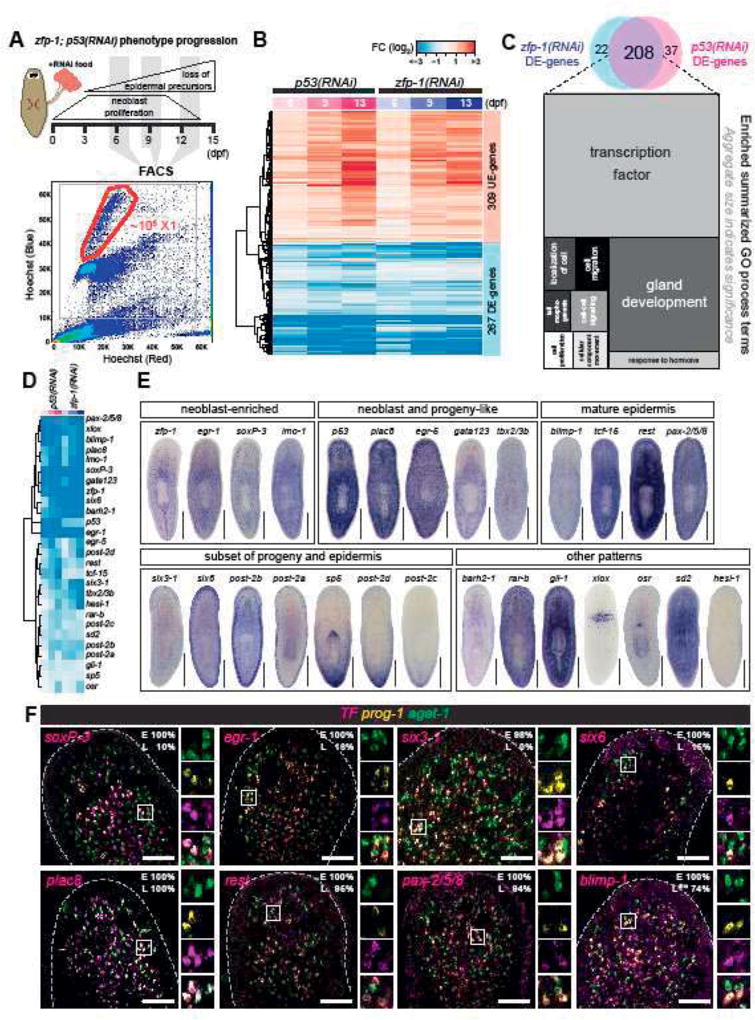
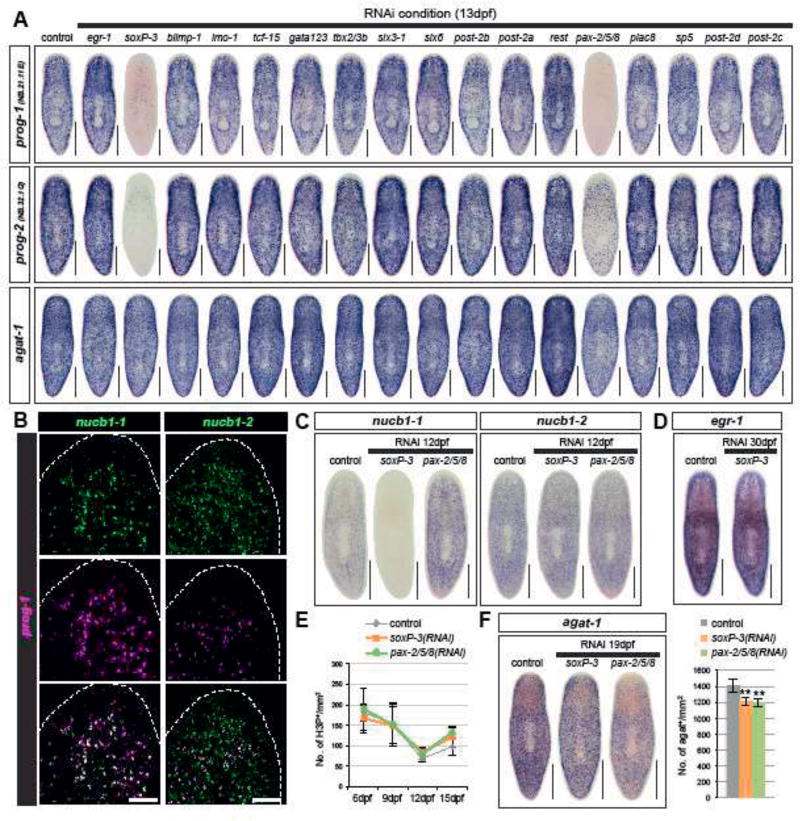
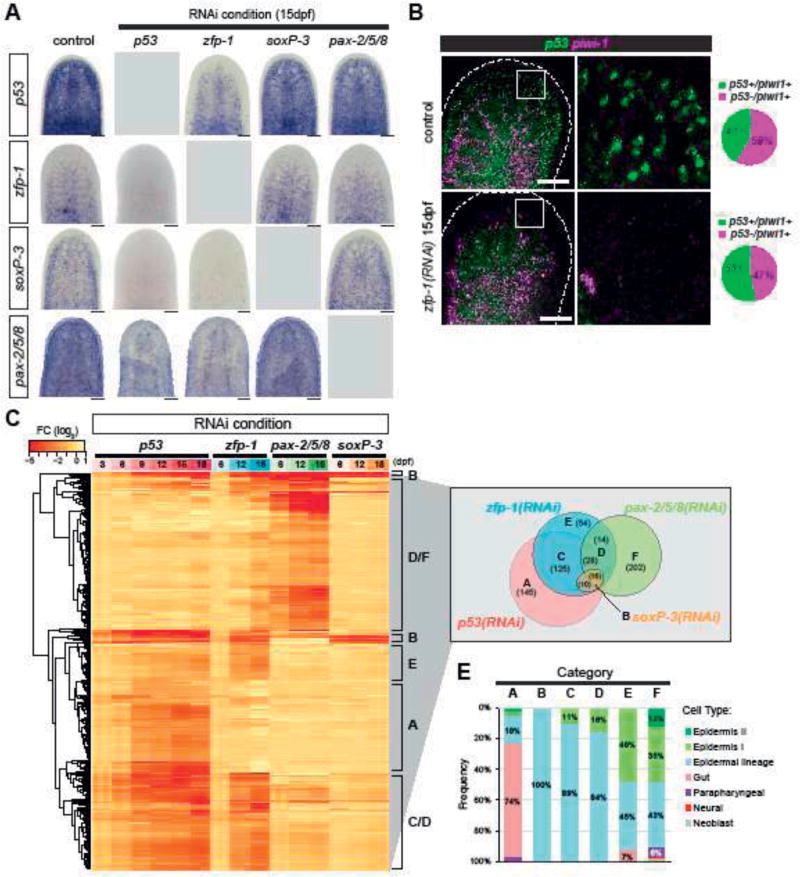
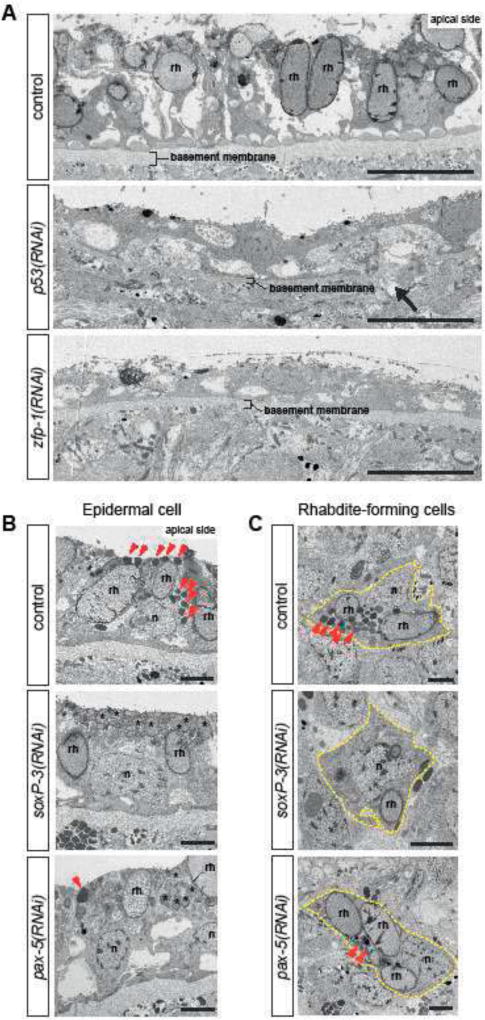
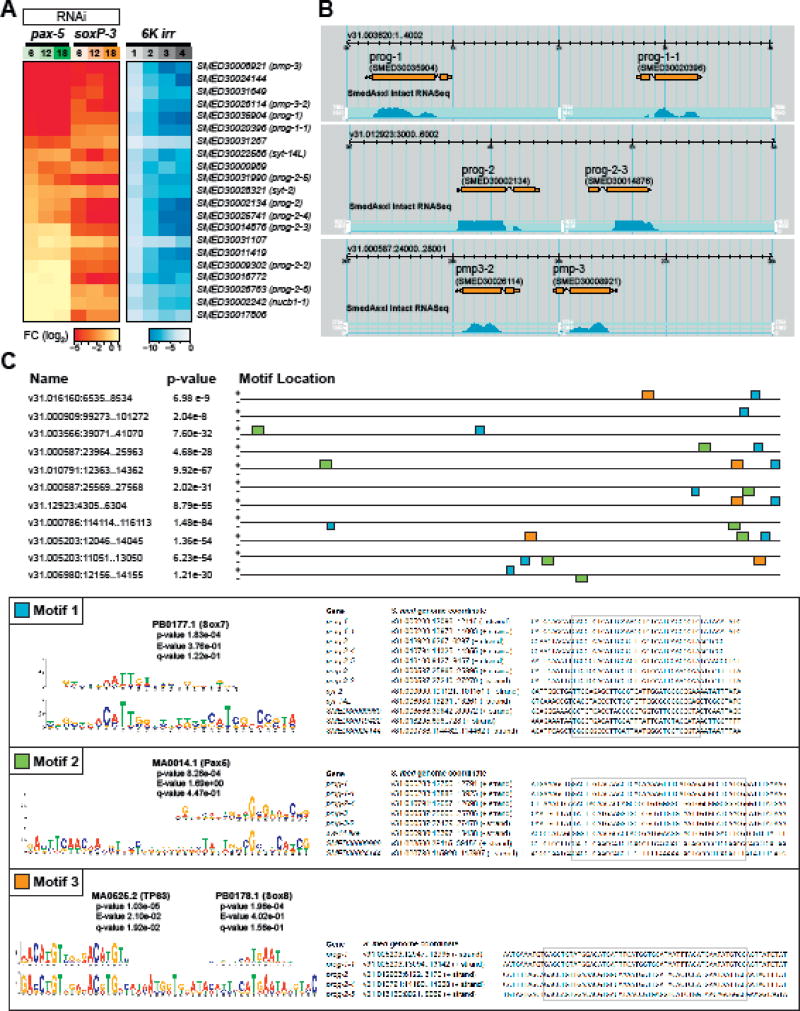
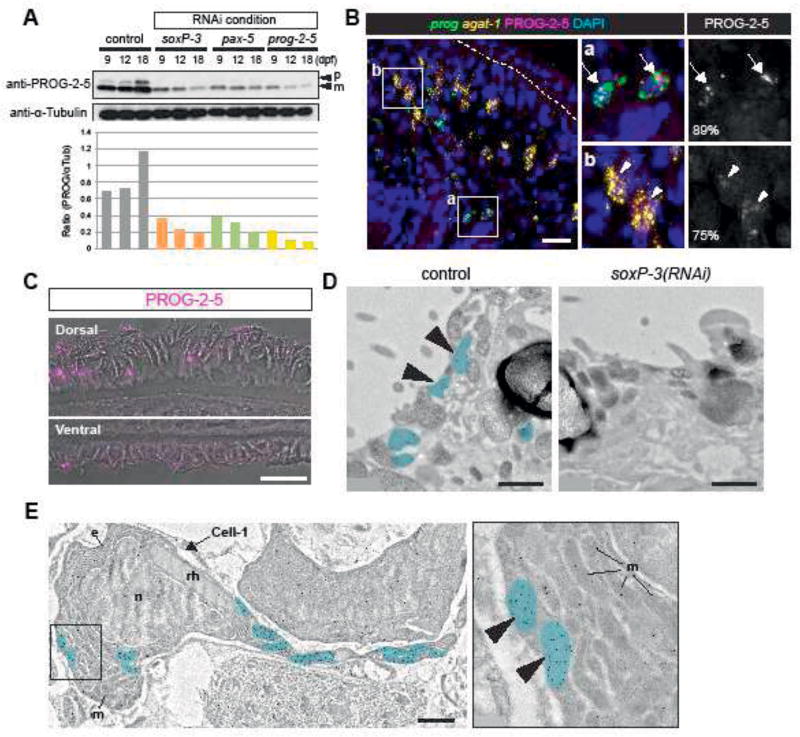
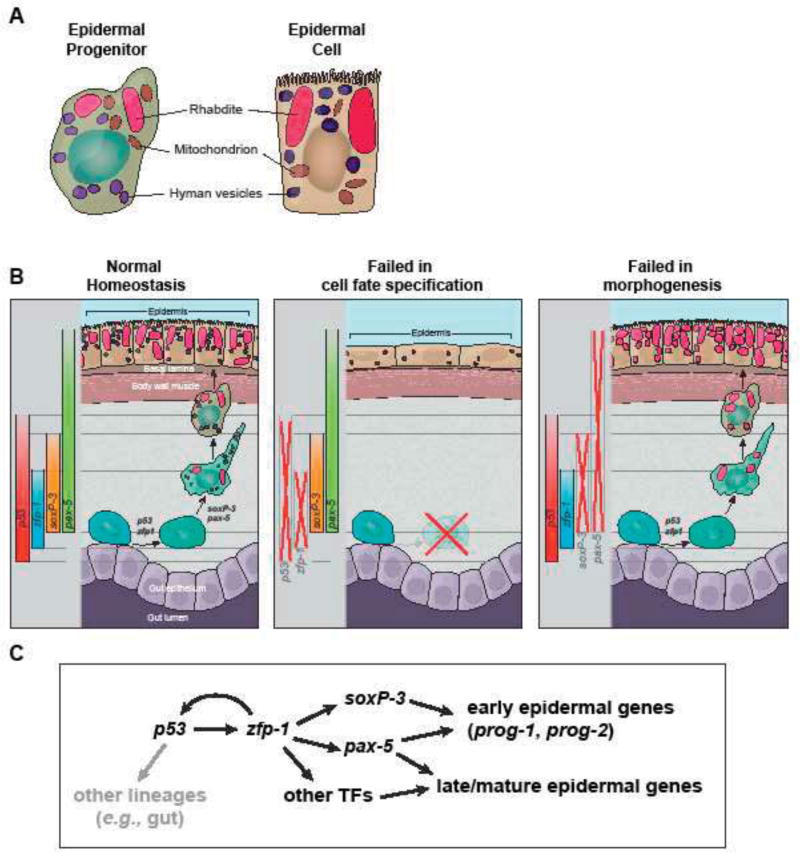
The epidermis is essential for animal survival, providing both a protective barrier and cellular sensor to external environments. The generally conserved embryonic origin of the epidermis, but the broad morphological and functional diversity of this organ across animals is puzzling. We define the transcriptional regulators underlying epidermal lineage differentiation in the planarian Schmidtea mediterranea, an invertebrate organism that, unlike fruitflies and nematodes, continuously replaces its epidermal cells. We find that Smed-p53, Sox and Pax transcription factors are essential regulators of epidermal homeostasis, and act cooperatively to regulate genes associated with early epidermal precursor cell differentiation, including a tandemly arrayed novel gene family (prog) of secreted proteins. Additionally, we report on the discovery of distinct and previously undescribed secreted organelles whose production is dependent on the transcriptional activity of soxP-3, and which we term Hyman vesicles.

Keywords: Epidermis; Stem cells; Transcription; p53; pax-2/5/8; soxP-3; zfp-1.


Figures

Figure 1
Figure 1. p53-and zfp-1 (RNAi) analyses define shared transcriptional changes in neoblasts and their differentiation progeny
(A) Schematic of experimental strategy. Planarians fed with dsRNA food were dissociated into cell suspensions on 6, 9, and 13 dpf, and the neoblasts were FACS-sorted for RNA-Seq. A representative FACS plot (control 9 dpf) shows the gating of dividing neoblasts (X1). (B) RNA-Seq analysis of 576 genes shows highly correlated expression profiles in p53-and zfp-1(RNAi) X1 cells (selection criteria: FC > 1.5, p-adj < 0.01, ≥ 2 time points). Each column represents data of one time point. DE, down-regulated in expression. UE, up-regulated in expression. Colors represent log2 fold change (FC) to control. Color key is the same in Figure 1B and 1D. (C) Venn diagram of p53-and zfp-1(RNAi) DE-genes and the major GO terms enriched in the 208 common DE-genes. Related GO terms are merged in the same shade and the size indicates significance of a group of GO terms (Supek et al., 2011). (D) Expression profiles of the transcription factors (TFs) identified in the common DE-genes of p53-and zfp-1(RNAi) X1 cells. (E) WISH patterns of candidate TFs. Scale bar, 500µm. (F) Co-localization of TF, prog-1 and agat-1 analyzed by FISH. Box region is split into individual channels to the right. Percentage of early (E) or late (L) progeny cells detected positive for candidate TF are shown in the upper right corner. Scale bar, 100µm.
Figure 2
Figure 2. soxP-3 and pax-2/5/8 regulate early epidermal precursor trasncription
(A) soxP-3-and pax-2/5/8(RNAi) animals show reduced WISH signals of early progeny markers (prog-1 and prog-2, 100% penetrance) but not late progeny marker agat-1 in the TF RNAi screen (n > 8 per RNAi, 2 independent experiments). Scale bar, 500µm. (B) nucb1-1 is 100% co-localized with prog-1 analyzed by FISH. nucb1-2 is partially overlapped with prog-1 and may label late progeny cells. Scale bar, 100µm. (C) Expression of nucb1-1 and nucb1-2 analyzed by WISH. nucb1-1 expression is eliminated in soxP-3(RNAi) animals but is up-regulated in pax-2/5/8(RNAi) animals (n > 6 per RNAi, 100% penetrance). nucb1-2 expression is unaffected in both soxP-3-and pax-2/5/8(RNAi) animals. Scale bar, 500µm. (D) egr-1 expression is unaffected by soxP-3 RNAi. Scale bar, 500µm. (E) Neoblast proliferation is unaffected by soxP-3-and pax-2/5/8 RNAi analyzed by H3P immunostaining (mean ± s.d., n > 8 per time point). (F) agat-1+ cells are slightly reduced in soxP-3-and pax-2/5/8(RNAi) animals. Scale bar, 500µm. Quantification of agat-1+ cells is shown in the bar graph (mean ± s.d., n > 8). Double asterisks, p<0.001. Unpaired Student’s t-test.
Figure 3
Figure 3. p53, zfp-1, soxP-3 and pax-2/5/8 regulate shared and distinct gene sets in a hierarchical transcriptional network
(A) WISH of zfp-1, p53, soxP-3 and pax-2/5/8 in the corresponding RNAi. p53 RNAi eliminates the expression of all three TFs (n > 8, 100% penetrance). zfp-1 RNAi eliminates soxP-3 and pax-2/5/8 expression, and reduce p53 expression in subset of mesenchymal cells, likely due to the loss of early and late progeny cells. soxP-3 and pax-2/5/8 RNAi do not affect the expression of any of the other three TFs. Scale bar, 100µm. (B) p53 and piwi-1 double FISH shows that p53 expression in the neoblast is not reduced by zfp-1 RNAi. Scale bar, 100µm. Quantification of p53+ neoblasts of the representative images is shown in the pie charts (total cells counted: control = 1028; zfp-1(RNAi) = 648). (C) FISH of pooled riboprobes of sigma-class (soxP-1 and soxP-2), gamma-class (hnf-4 and gata456), and zeta-class (zfp-1, egr-1, soxP-3 and fgfr-1) is performed to identify neoblast sub-populations and their co-localization with p53. Boxed region is split into individual channels to the right. Arrowheads point to the triple positive cells. Scale bar, 100µm. (D) Expression profiles of 594 DE-genes identified in the RNA-Seq analysis of p53-, zfp-1-, pax-2/5/8-and soxP-3(RNAi) animals. Selection criteria of the gene list: FC > 2, p-adj < 0.001, ≥ 2 time points, except for p53(RNAi) in which FC > 2, p-adj < 0.001, ≥ 4 time points were used. DE-genes are classified into 7 major categories (A–F) and the numbers of each category are shown in the Venn diagram. (E) Cell type specific genes (Wurtzel et al., 2015) represented in the DE-gene Categories. Category A contains large numbers of gut markers. Categories B/C/D/E/F contain genes expressed along the epidermal lineage (including early progeny, late progeny and mature epidermis). More genes expressed in the mature epidermis are present in Category E and F.
Figure 4
Figure 4. Ultrastructural analysis show distinct epidermal defects inp53-, zfp-1-, soxP-3- and pax-2/5/8 (RNAi) animals
(A) TEM micrographs of ventral epidermis. p53-and zfp-1(RNAi) epidermis appear to be stretched, contain reduced number of rhabdites (rh) and sit on thinner basement membrane (arrow points to a rupture). n = 3, 100% penetrance. Scale bar, 10µm. (B) TEM micrographs of dorsal epidermis. The numbers of electron-dense granules (arrowheads) in the epidermal cells are greatly reduced by soxP-3-and pax-2/5/8 RNAi. Instead, the apical side of soxP-3 and pax-2/5/8(RNAi) epidermis are filled with rhabdite-like vesicles (asterisks). n, nucleus; rh, rhabdite. Scale bar, 2µm. (C) TEM micrographs of rhabdite-forming cells. Electron-dense granules (arrowheads) observed in the control cell are greatly reduced in soxP-3-and pax-2/5/8(RNAi) cells. Scale bar, 2µm.
Figure 5
Figure 5. soxP-3 and pax-2/5/8 regulate the expression of a novel gene family uniquely arranged in the S. mediterranea genome
(A) Expression profiles of Category B DE-genes (from Figure 4D) in the pax-2/5/8(RNAi), soxP-3 (RNAi) and irradiation time course RNA-Seq analysis. (B) Screenshot of SmedGD browser showing paired prog and pmp gene loci in the S. mediterranea genome V3.1 (Robb et al., 2015). (C) Top three motifs over-represented in the upstream 2kb sequences of DE-genes common in soxP-3-and pax-2/5/8(RNAi). The consensus matrix of vertebrate Sox7, Pax5, TP63 and Sox8 binding sites derived from TRANSFAC database and the genome coordinates of the motif sites are shown in the box.
Figure 6
Figure 6. PROG-2-5 proteins are found associated with granules in the planarian epidermis
(A) Western blot analysis of PROG-2-5 in soxP-3-, pax-2/5/8-and prog-2-5(RNAi) whole worm lysates. Two bands corresponding to the precursor form (p) and mature form (m) of PROG-2-5 proteins are both significantly down-regulated in the RNAi lysates. Relative densities of PROG-2-5 bands to α-Tubulin are shown at the bottom. (B) Immunostaining of anti-PROG-2-5 combined with double FISH of prog (prog-1 + prog-2 mix) and agat-1. Higher magnification of the boxed regions (a and b) is shown in the right panel. Large PROG-2-5+ puncta are observed in 89% of early progeny (prog+) cells (a, arrows). Smaller PROG-2-5+ puncta are also detected in 75% of late progeny (agat-1+) cells (b, arrowheads). Total 341 cells sampled from 5 animals are analyzed. Scale bar, 20µm. (C) Confocal/DIC images of PROG-2-5 immunostaining in the epidermis. Anti-PROG-2-5 detects puncta on both dorsal and ventral epidermis. Scale bar, 20µm. (D) IEM images showing the apical side of epidermal cells. In the control epidermal cell, immuno-gold labeled anti-PROG-2-5 antibodies detect signals in the oval-shaped granules (pseudo-colored in blue). PROG-2-5+ granules are undetectable in soxP-3(RNAi) epidermal cells. n = 2. Scale bar, 1µm. (E) IEM image of a mesenchymal cell labeled with anti-PROG-2-5 immuno-gold. Large rhod-shaped granules resembling rhabdites are found in the same cell labeled with PROG-2-5+ oval-shaped granules (pseudo-colored in blue) (also see Figure 7 - figure supplement 3). Higher magnification of the boxed region is shown in the right panel. e, endoplasmic reticulum; m, mitochondria; n, nucleus; rh, rhabdite. Scale bar, 1µm.
Figure 7
Figure 7. Model of epidermal lineage progression in planarian
(A) Schematic of ultrastructures of epidermal precursor and mature epidermal cell. Epidermal precursors contain features of the mature epidermal cells including large rod-shape rhabdites and small oval-shape granules. They are also abundant in mitochondria. (B) Schematic of the planarian epidermal lineage progression and the phenotypic differences in p53-, zfp-1-, soxP-3 and pax-2/5/8 (RNAi) animals. (C) Proposed transcription network in the epidermal lineage progression. Gray arrow represents aspects of the network not studied in depth.

References

    1. Ashburner M, Ball CA, Blake JA, Botstein D, Butler H, Cherry MJ, Davis AP, Dolinski K, Dwight SS, Eppig JT, et al. Gene Ontology: tool for the unification of biology. Nature Genetics. 2000;25(1):25–29. - PMC - PubMed
    1. Bailey TL, Johnson J, Grant CE, Noble WS. The MEME Suite. Nucleic Acids Research. 2015;43(W1) - PMC - PubMed
    1. Benjamini Y, Hochberg Y. On the Adaptive Control of the False Discovery Rate in Multiple Testing with Independent Statistics. Journal of Educational and Behavioral Statistics. 2000;25(1):60.
    1. Boxer LD, Barajas B, Tao S, Zhang J, Khavari PA. ZNF750 interacts with KLF4 and RCOR1, KDM1A, and CTBP1/2 chromatin regulators to repress epidermal progenitor genes and induce differentiation genes. Genes & Development. 2014;28(18):2013–2026. - PMC - PubMed
    1. Cebrià F, Newmark PA. Planarian homologs of netrin and netrin receptor are required for proper regeneration of the central nervous system and the maintenance of nervous system architecture. Development. 2005;132(16):3691–3703. - PubMed

Publication types

MeSH terms