

Biomarkers of Tuberculosis Severity and Treatment Effect: A Directed Screen of 70 Host Markers in a Randomized Clinical Trial
- PMID: 29100778
- PMCID: PMC5704068
- DOI: 10.1016/j.ebiom.2017.10.018
Biomarkers of Tuberculosis Severity and Treatment Effect: A Directed Screen of 70 Host Markers in a Randomized Clinical Trial
Abstract
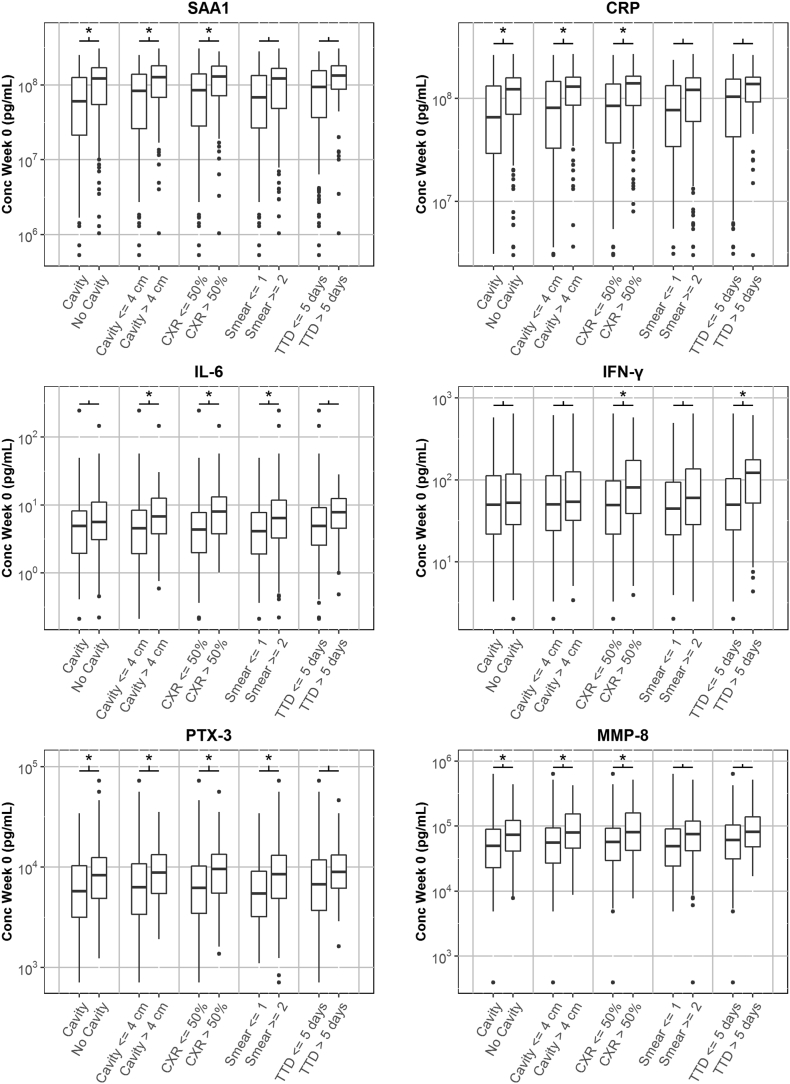
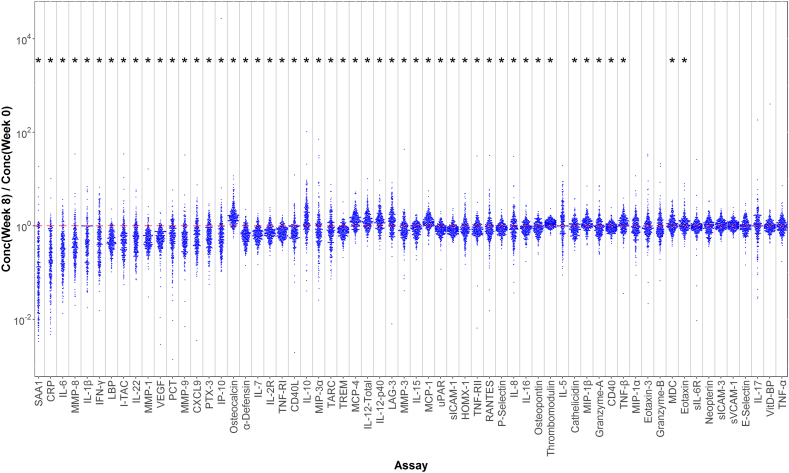
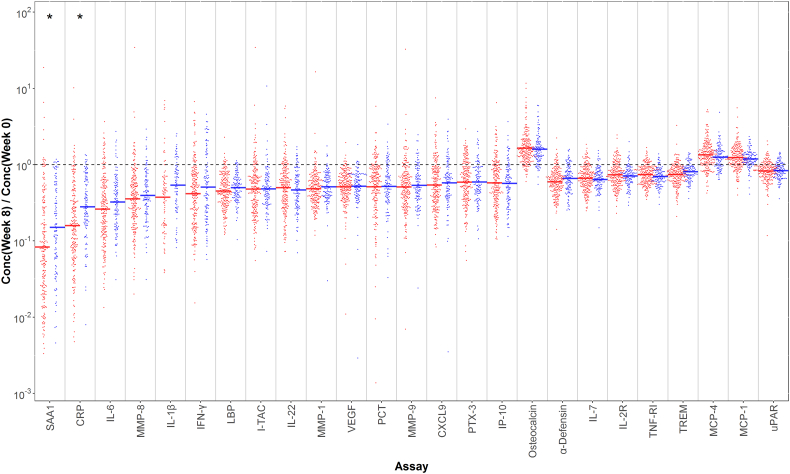
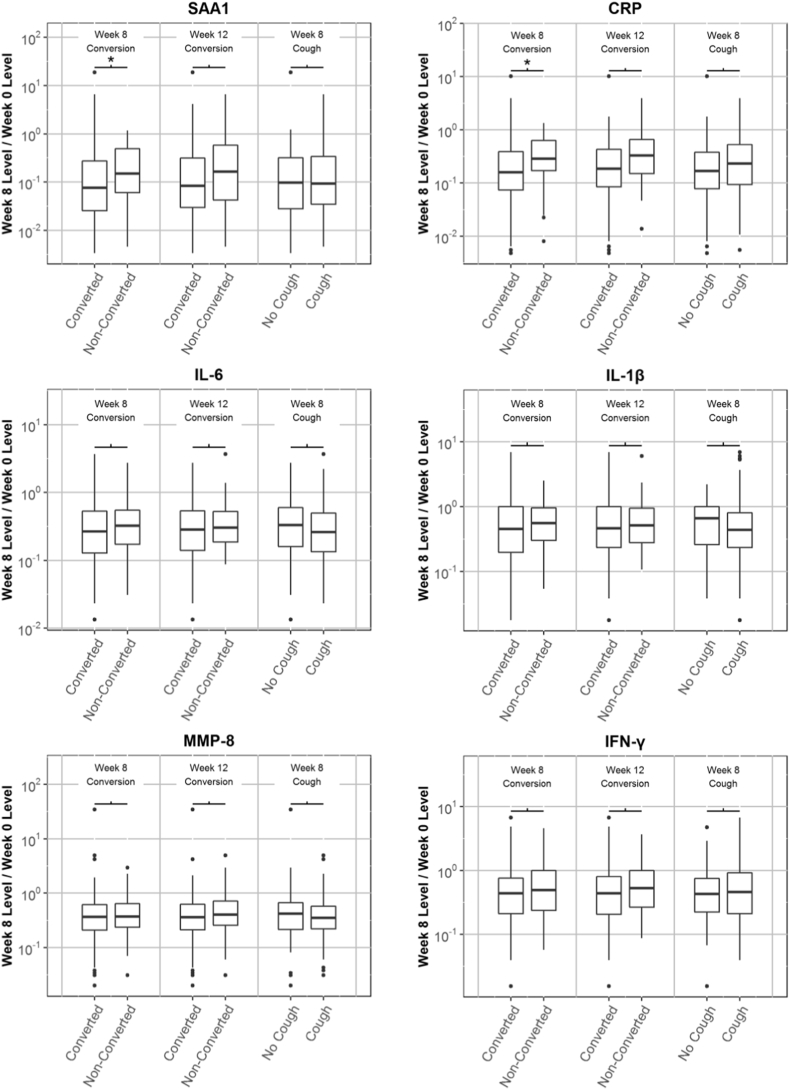
More efficacious treatment regimens are needed for tuberculosis, however, drug development is impeded by a lack of reliable biomarkers of disease severity and of treatment effect. We conducted a directed screen of host biomarkers in participants enrolled in a tuberculosis clinical trial to address this need. Serum samples from 319 protocol-correct, culture-confirmed pulmonary tuberculosis patients treated under direct observation as part of an international, phase 2 trial were screened for 70 markers of infection, inflammation, and metabolism. Biomarker assays were specifically developed for this study and quantified using a novel, multiplexed electrochemiluminescence assay. We evaluated the association of biomarkers with baseline characteristics, as well as with detailed microbiologic data, using Bonferroni-adjusted, linear regression models. Across numerous analyses, seven proteins, SAA1, PCT, IL-1β, IL-6, CRP, PTX-3 and MMP-8, showed recurring strong associations with markers of baseline disease severity, smear grade and cavitation; were strongly modulated by tuberculosis treatment; and had responses that were greater for patients who culture-converted at 8weeks. With treatment, all proteins decreased, except for osteocalcin, MCP-1 and MCP-4, which significantly increased. Several previously reported putative tuberculosis-associated biomarkers (HOMX1, neopterin, and cathelicidin) were not significantly associated with treatment response. In conclusion, across a geographically diverse and large population of tuberculosis patients enrolled in a clinical trial, several previously reported putative biomarkers were not significantly associated with treatment response, however, seven proteins had recurring strong associations with baseline radiographic and microbiologic measures of disease severity, as well as with early treatment response, deserving additional study.
Keywords: Biomarkers; Clinical trials; Host immune response; Tuberculosis.
Copyright © 2017 The Authors. Published by Elsevier B.V. All rights reserved.
Figures
Comment in
-
Biomarkers for Treatment Monitoring in Tuberculosis: A New Hope.EBioMedicine. 2017 Dec;26:13-14. doi: 10.1016/j.ebiom.2017.11.002. Epub 2017 Nov 3. EBioMedicine. 2017. PMID: 29129701 Free PMC article. No abstract available.
References
-
- Azzurri A., Sow O.Y., Amedei A. IFN-gamma-inducible protein 10 and pentraxin 3 plasma levels are tools for monitoring inflammation and disease activity in Mycobacterium tuberculosis infection. Microbes Infect. 2005;7(1):1–8. - PubMed
-
- Baba S., Takahashi T., Kasama T., Shirasawa H. Identification of two novel amyloid A protein subsets coexisting in an individual patient of AA-amyloidosis. Biochim. Biophys. Acta. 1992;1180(2):195–200. - PubMed
Publication types
MeSH terms
Substances
Grants and funding
LinkOut - more resources
Full Text Sources
Other Literature Sources
Research Materials
Miscellaneous
