

A pharmacologically immunosuppressed mouse model for assessing influenza B virus pathogenicity and oseltamivir treatment
- PMID: 29100887
- PMCID: PMC7202083
- DOI: 10.1016/j.antiviral.2017.10.021
A pharmacologically immunosuppressed mouse model for assessing influenza B virus pathogenicity and oseltamivir treatment
Abstract
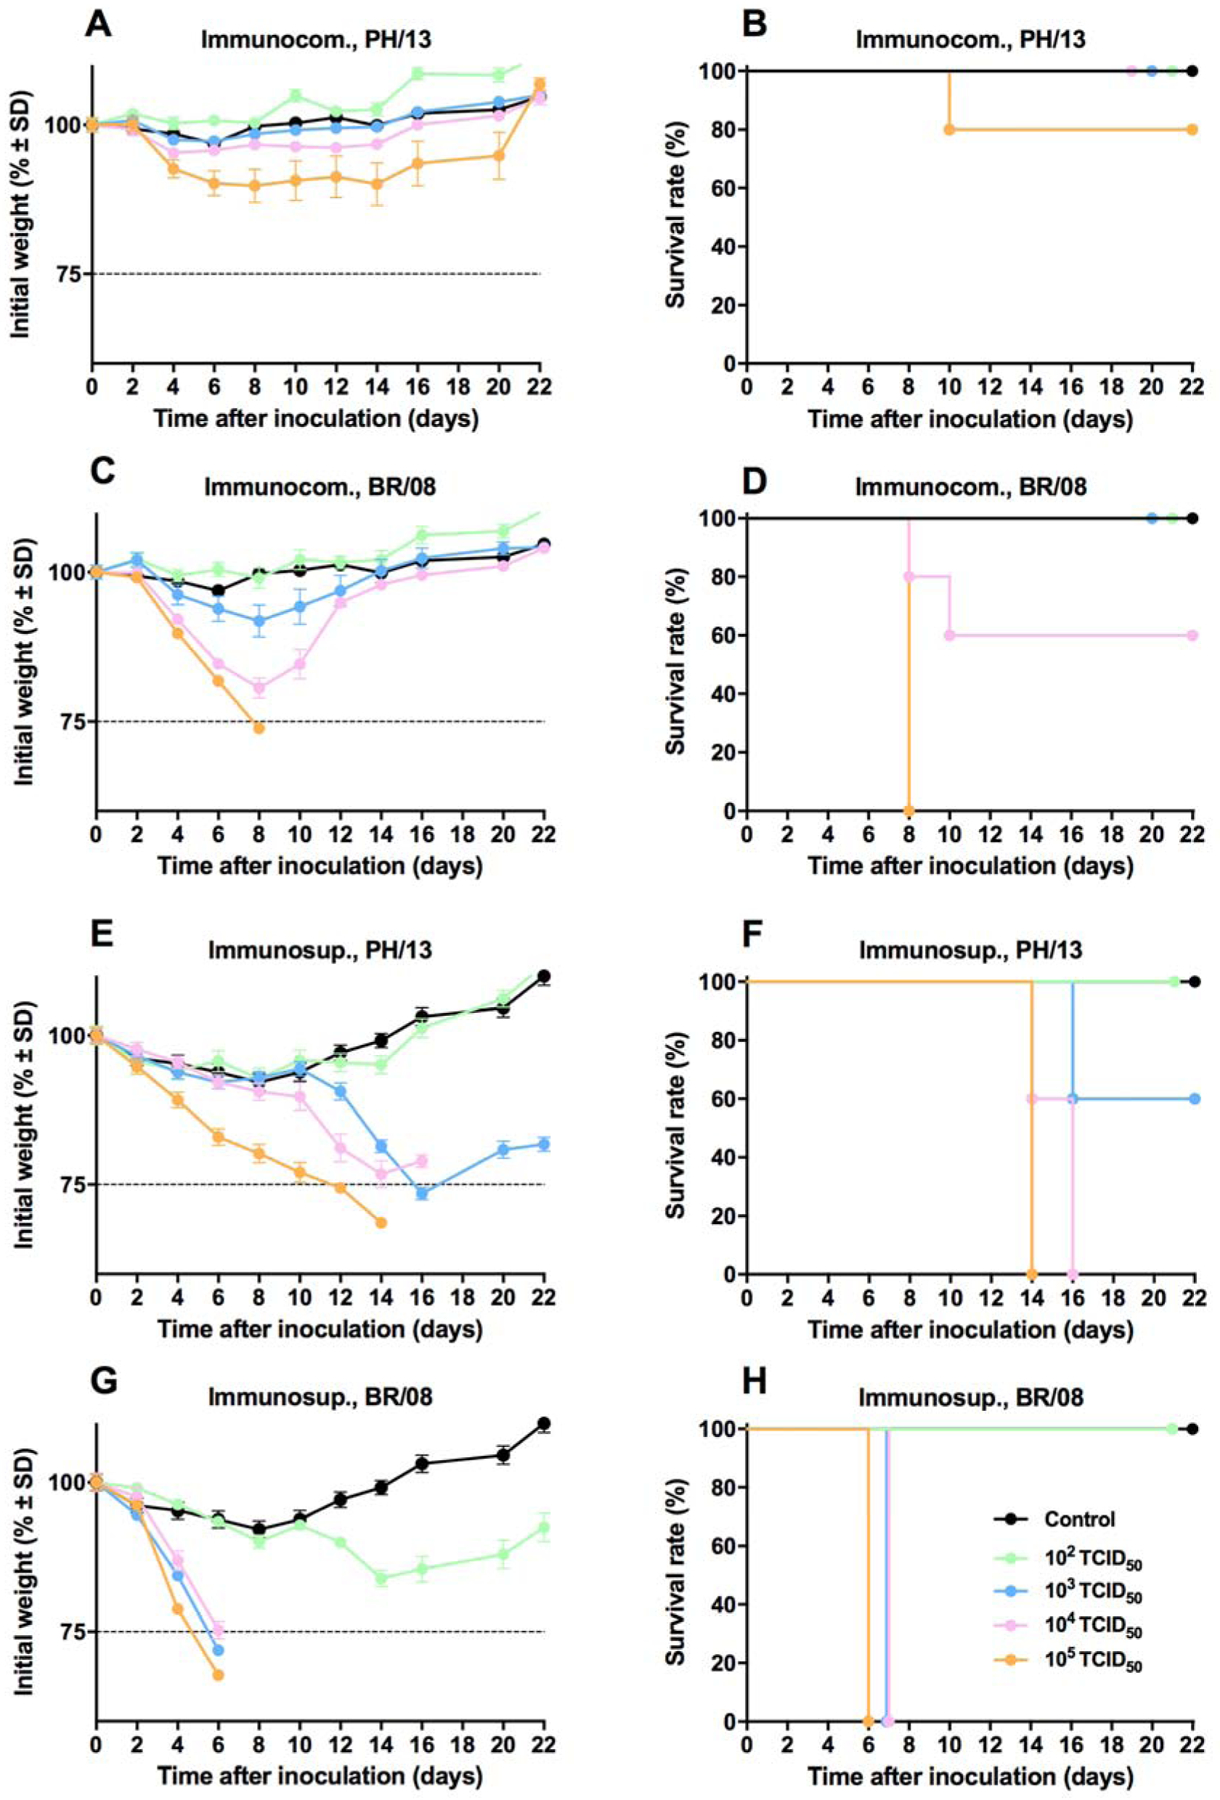
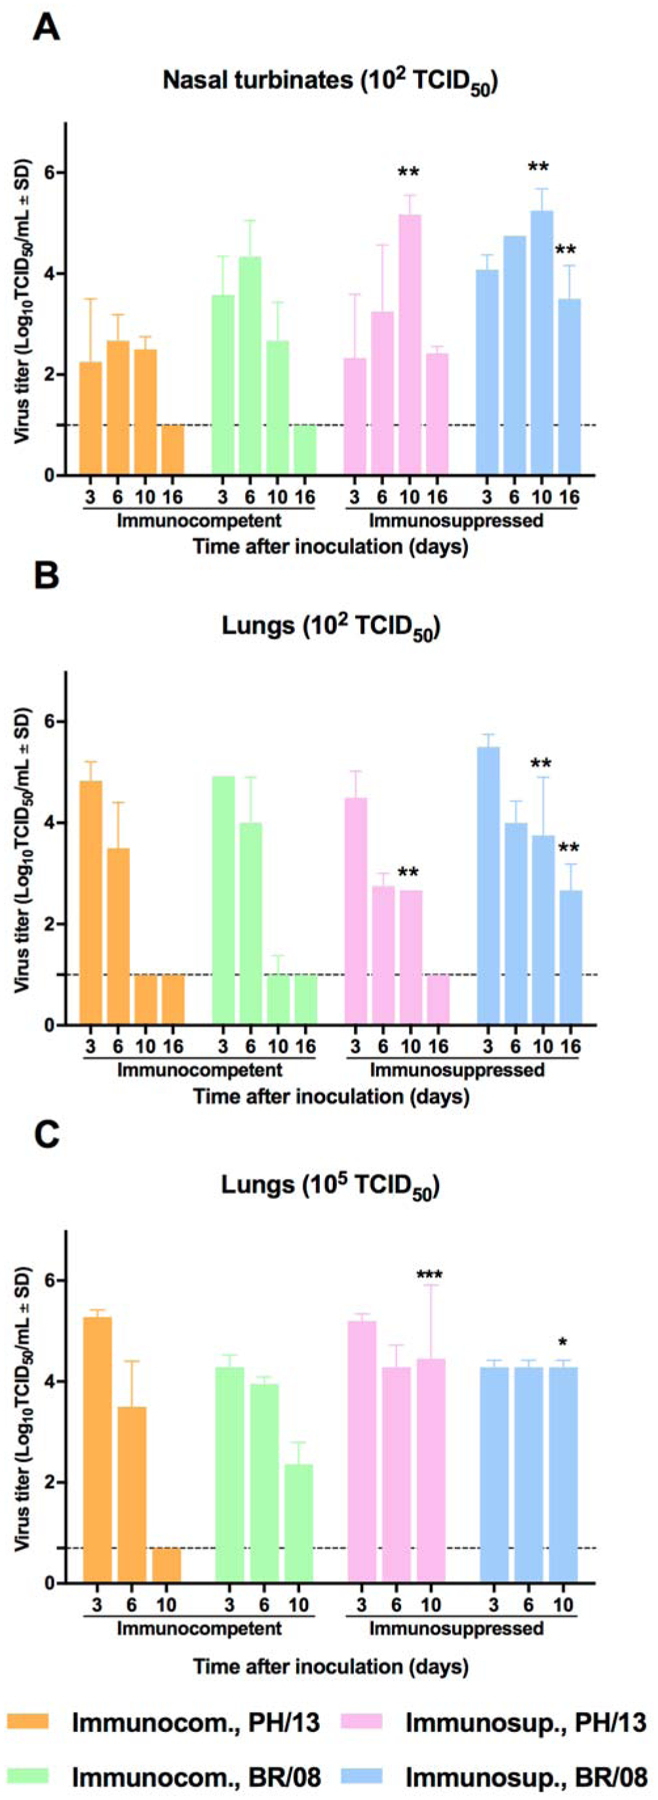
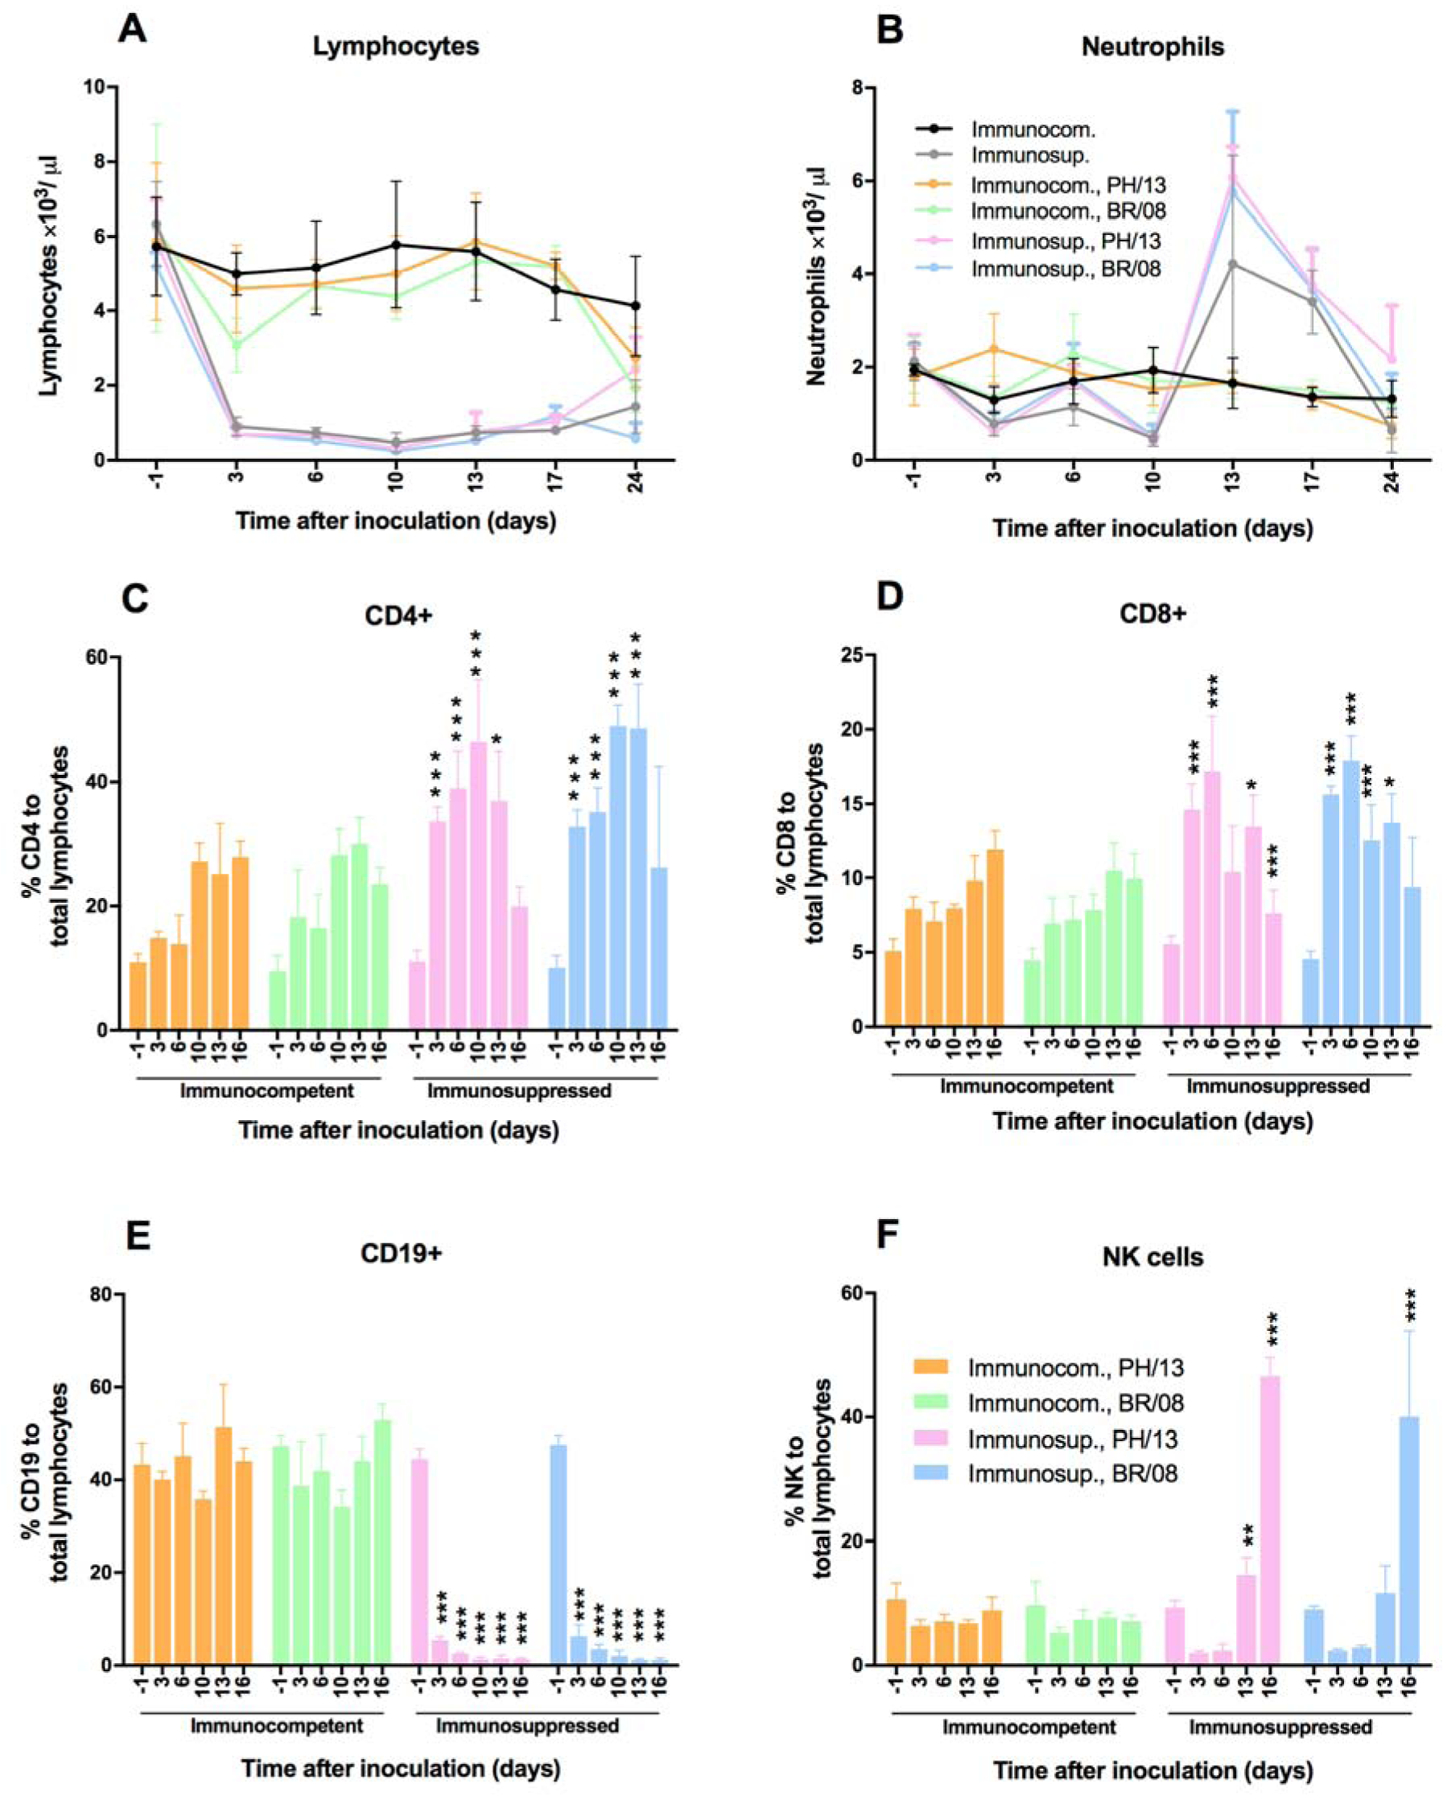
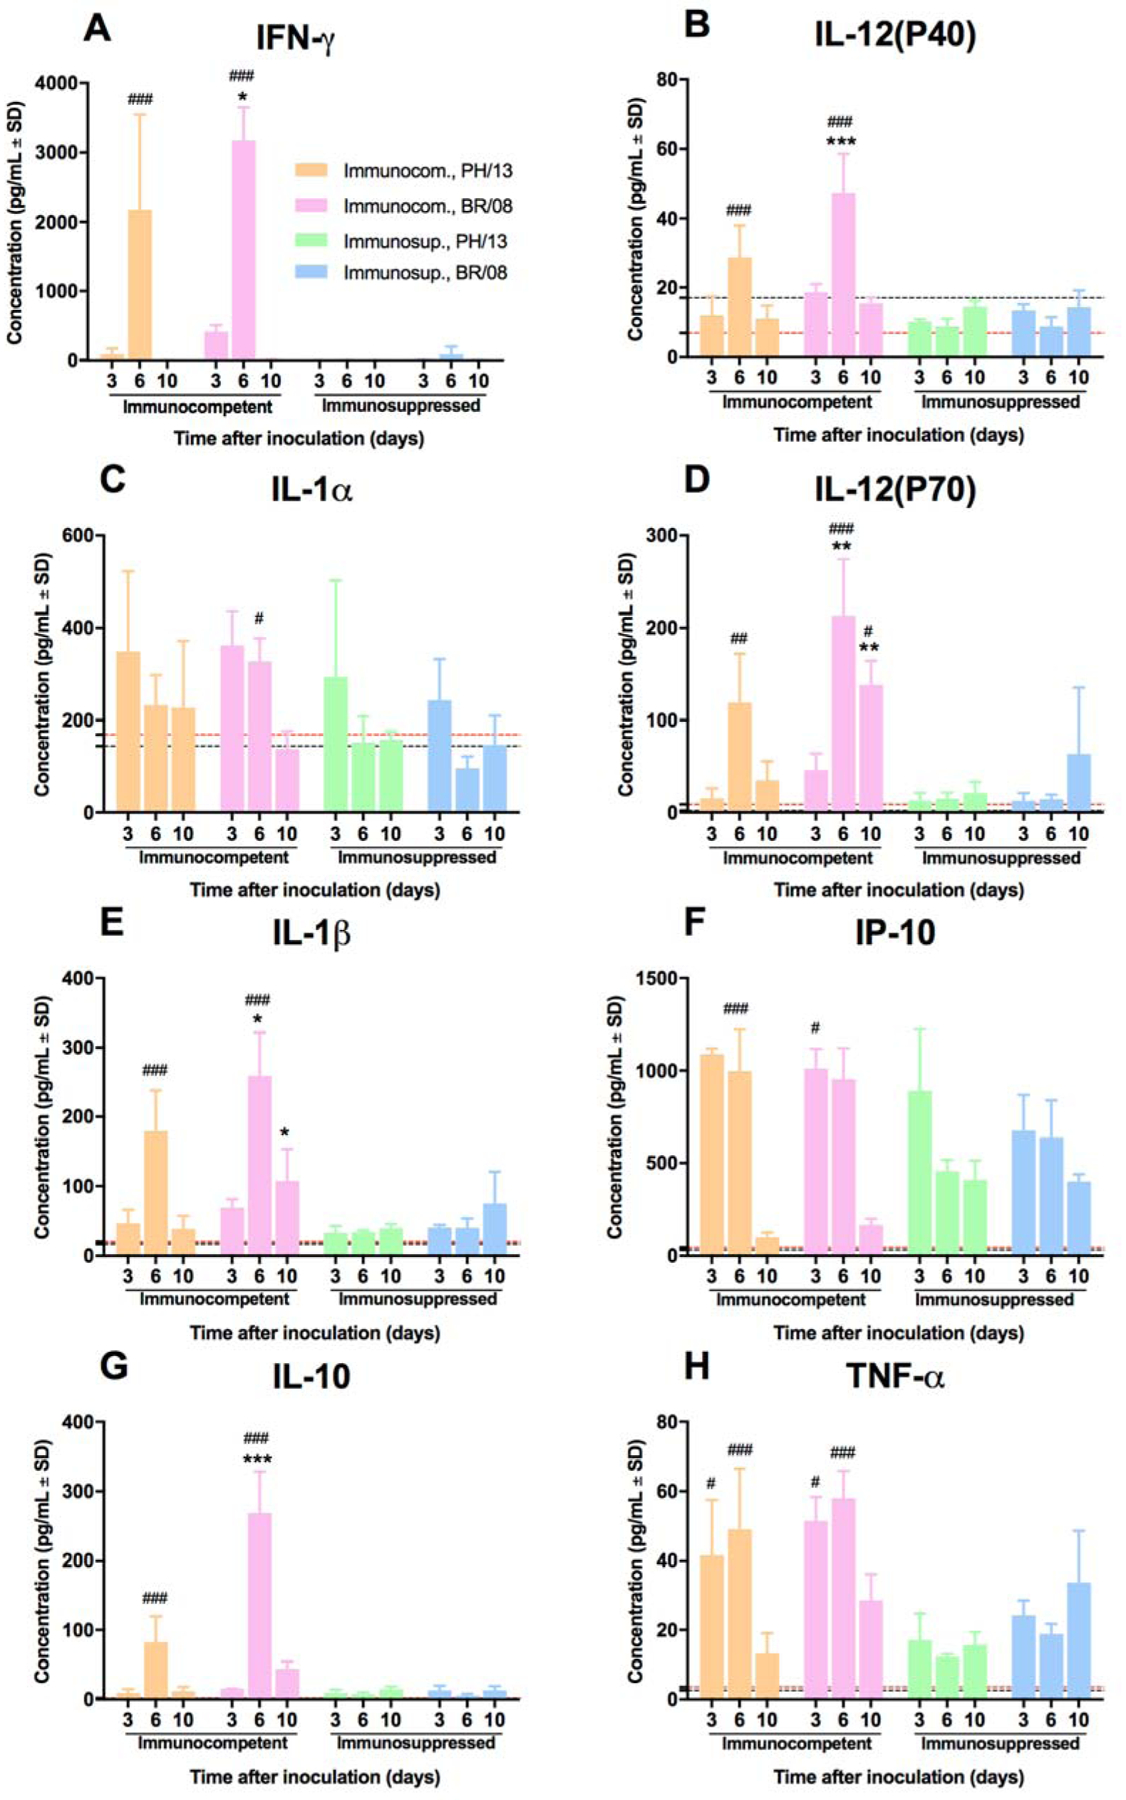
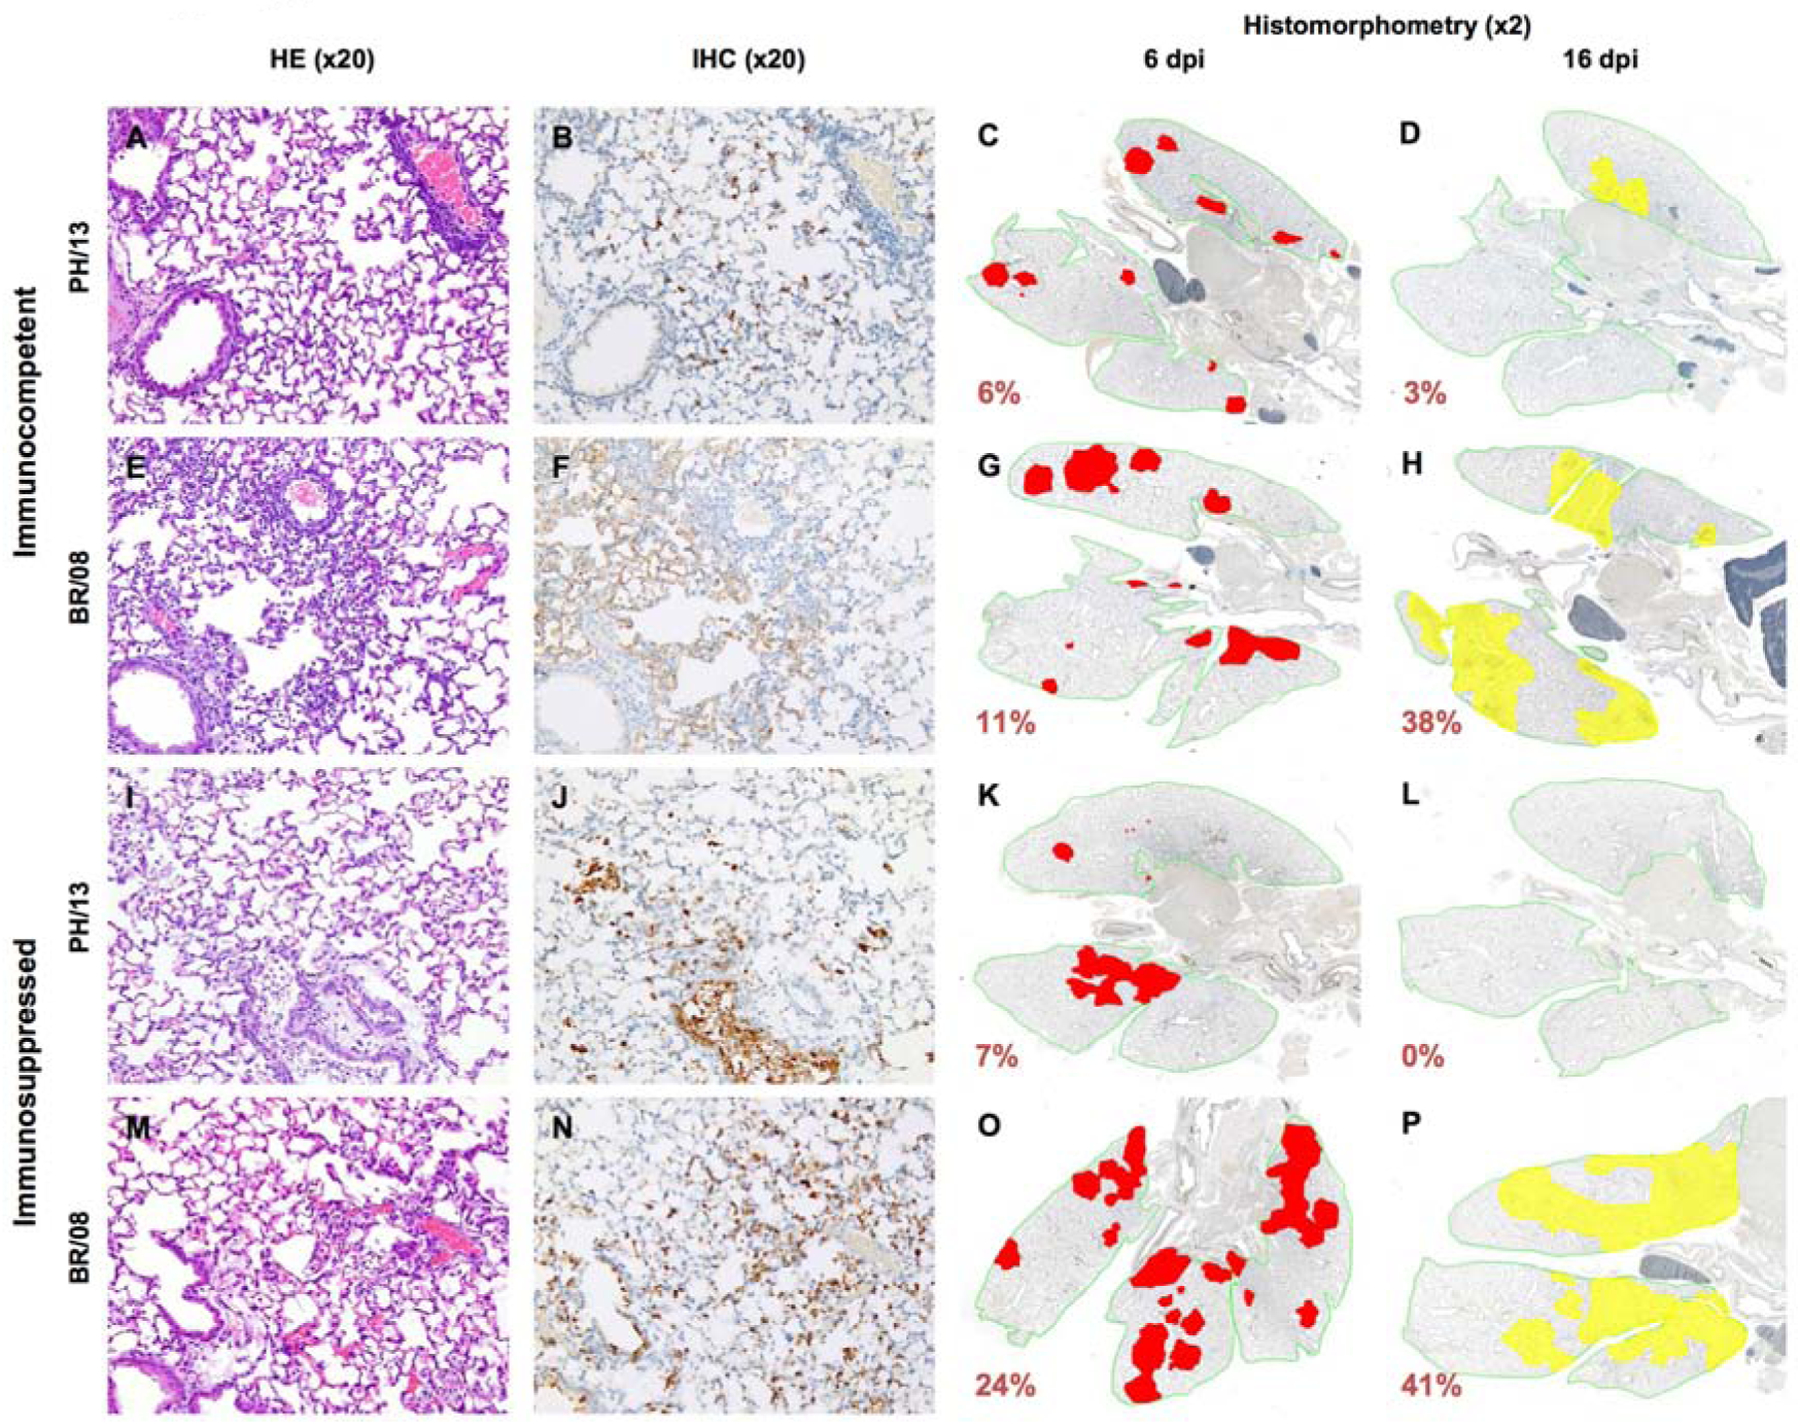
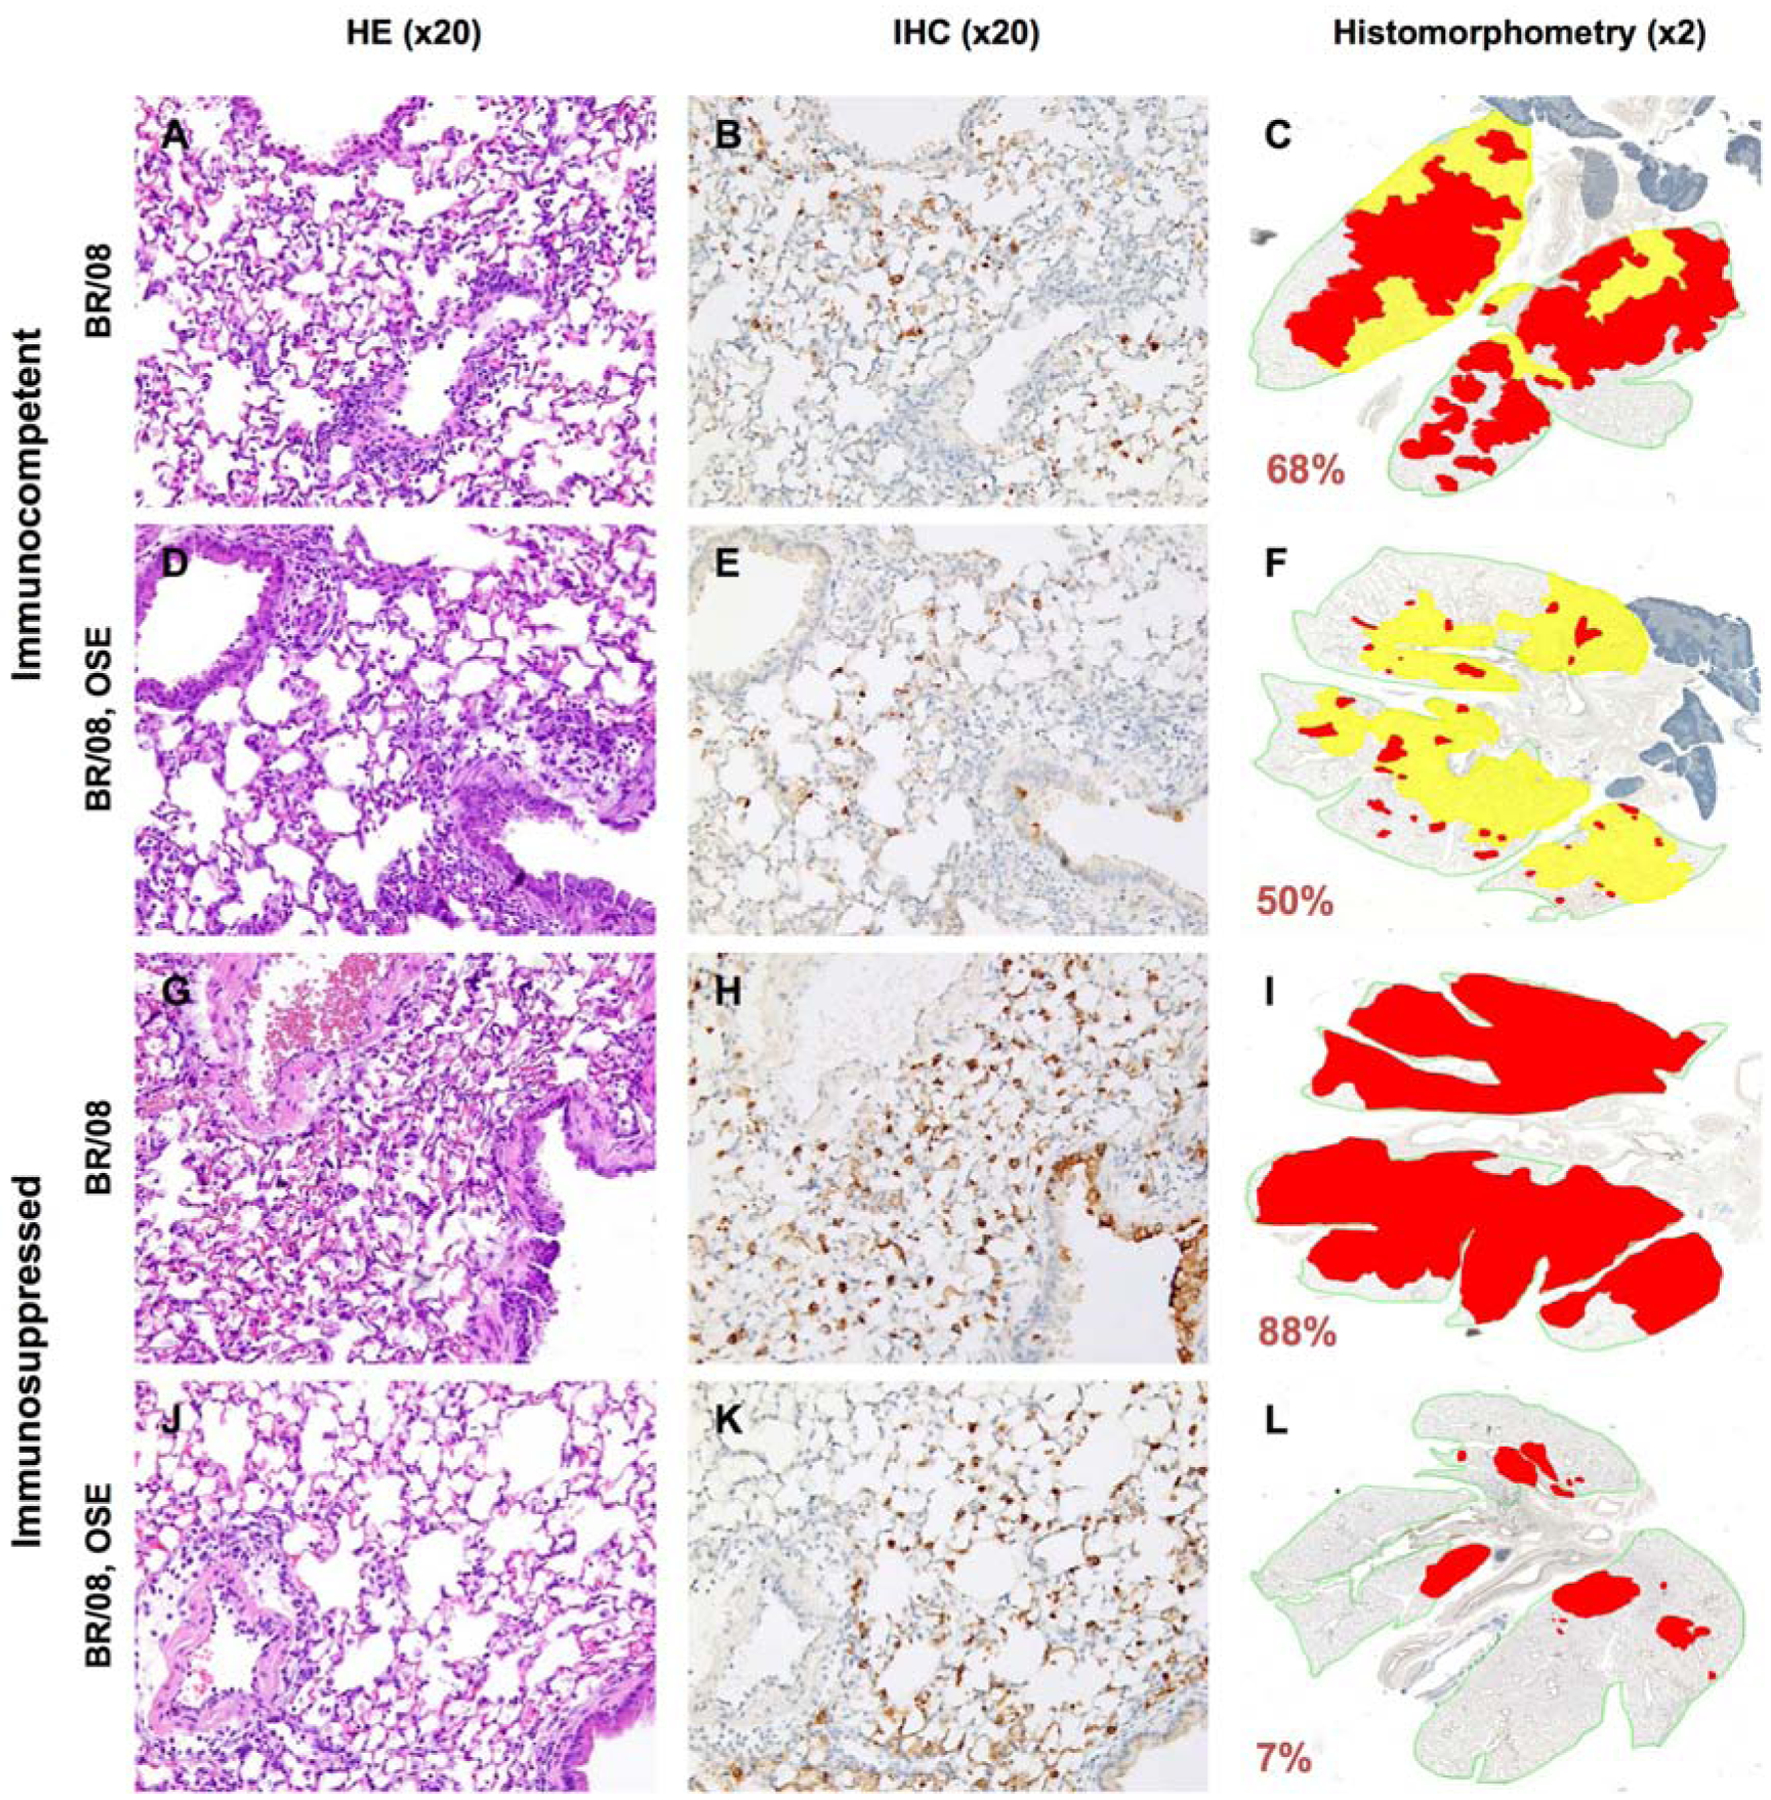
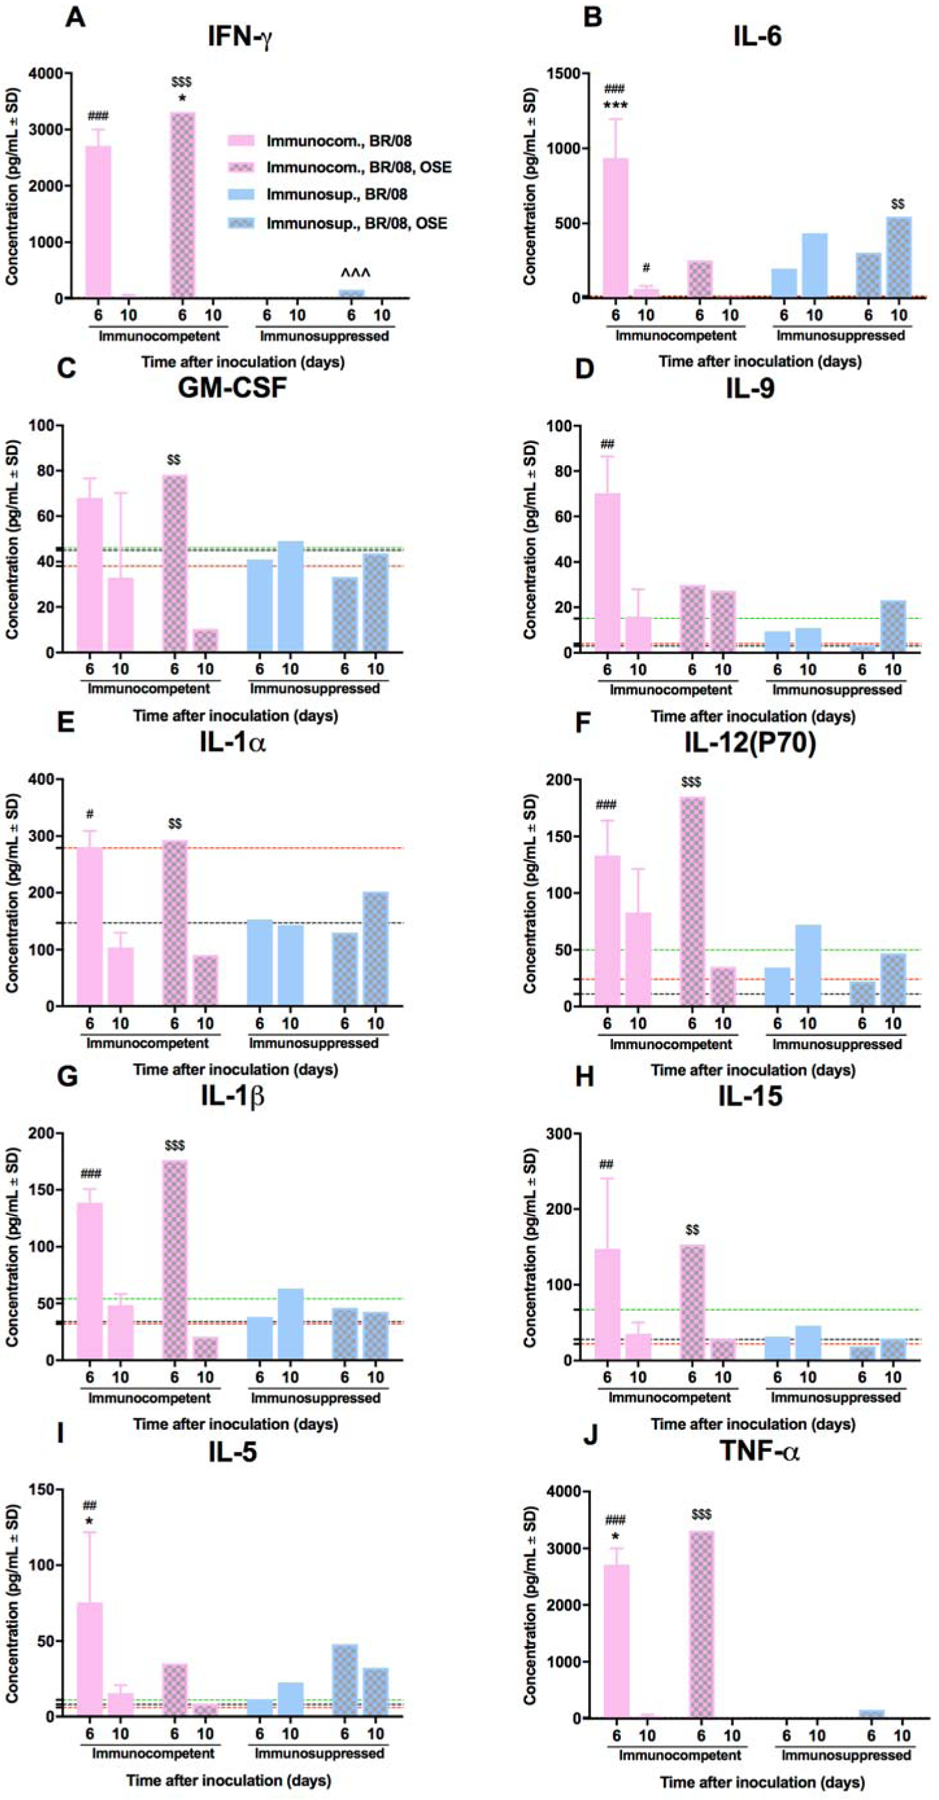
Immunocompromised patients are highly susceptible to influenza virus infections. Although neuraminidase inhibitor (NAI) therapy has proved effective in these patients, the treatment regimens require optimization, which can be partly addressed via animal models. Here, we describe a pharmacologically immunosuppressed mouse model for studying the pathogenesis of influenza B viruses and evaluating the efficacy of antiviral treatment. We modeled clinical regimens for dexamethasone and cyclophosphamide to immunosuppress BALB/c mice that were then inoculated with B/Phuket/3073/2013 (Yamagata lineage) or B/Brisbane/60/2008 (BR/08, Victoria lineage) virus. Although both viruses caused morbidity and mortality in immunosuppressed mice, BR/08 was more virulent, consistently inducing greater morbidity and 100% lethality in mice inoculated with at least 103 TCID50/mouse. The replication of both viruses was prolonged in the lungs of immunosuppressed mice, but the extent of pulmonary inflammation in these mice was markedly less than that in immunocompetent animals. Most of the examined cytokines, including IFN-γ, IL-1β, and RANTES, were significantly decreased in the lungs of immunosuppressed mice, as compared to immunocompetent animals, until at least 10 days post-infection. Treatment with the NAI oseltamivir for 8 or 16 days increased the mean survival time and reduced virus spread in the lungs of immunosuppressed mice challenged with a lethal dose of BR/08 but did not completely provide protection or decrease the virus titers. Our data suggests that the synergy of the viral load and aberrant immune responses is a key contributor to the severity of infection, as well as the limited efficacy of oseltamivir, which in immunosuppressed mice curtails virus release without clearing infected cells.
Keywords: Antiviral treatment; Immune responses; Immunosuppressed mice; Influenza B virus; Oseltamivir; Pathogenesis.
Copyright © 2017 Elsevier B.V. All rights reserved.
Conflict of interest statement
Figures
Similar articles
-
Pathogenicity and peramivir efficacy in immunocompromised murine models of influenza B virus infection.Sci Rep. 2017 Aug 4;7(1):7345. doi: 10.1038/s41598-017-07433-z. Sci Rep. 2017. PMID: 28779075 Free PMC article.
-
Optimizing T-705 (favipiravir) treatment of severe influenza B virus infection in the immunocompromised mouse model.J Antimicrob Chemother. 2019 May 1;74(5):1333-1341. doi: 10.1093/jac/dky560. J Antimicrob Chemother. 2019. PMID: 30715325 Free PMC article.
-
Reduction of Neuraminidase Activity Exacerbates Disease in 2009 Pandemic Influenza Virus-Infected Mice.J Virol. 2016 Oct 14;90(21):9931-9941. doi: 10.1128/JVI.01188-16. Print 2016 Nov 1. J Virol. 2016. PMID: 27558428 Free PMC article.
-
Neuraminidase inhibitor resistance in influenza viruses.J Med Virol. 2007 Oct;79(10):1577-86. doi: 10.1002/jmv.20951. J Med Virol. 2007. PMID: 17705169 Review.
-
Review of the clinical effectiveness of the neuraminidase inhibitors against influenza B viruses.Expert Rev Anti Infect Ther. 2013 Nov;11(11):1135-45. doi: 10.1586/14787210.2013.842466. Epub 2013 Oct 7. Expert Rev Anti Infect Ther. 2013. PMID: 24093683 Review.
Cited by
-
Dynamically linking influenza virus infection kinetics, lung injury, inflammation, and disease severity.Elife. 2021 Jul 20;10:e68864. doi: 10.7554/eLife.68864. Elife. 2021. PMID: 34282728 Free PMC article.
-
Host-pathogen kinetics during influenza infection and coinfection: insights from predictive modeling.Immunol Rev. 2018 Sep;285(1):97-112. doi: 10.1111/imr.12692. Immunol Rev. 2018. PMID: 30129197 Free PMC article. Review.
-
Interleukin-17-A multifaceted cytokine in viral infections.J Cell Physiol. 2021 Dec;236(12):8000-8019. doi: 10.1002/jcp.30471. Epub 2021 Jun 16. J Cell Physiol. 2021. PMID: 34133758 Free PMC article. Review.
-
Th17 serum cytokines in relation to laboratory-confirmed respiratory viral infection: A pilot study.J Med Virol. 2019 Jun;91(6):963-971. doi: 10.1002/jmv.25406. Epub 2019 Feb 4. J Med Virol. 2019. PMID: 30715745 Free PMC article.
-
Nanobodies Are Potential Therapeutic Agents for the Ebola Virus Infection.Acta Naturae. 2021 Oct-Dec;13(4):53-63. doi: 10.32607/actanaturae.11487. Acta Naturae. 2021. PMID: 35127147 Free PMC article.
References
-
- Ariano RE, Sitar DS, Zelenitsky SA, Zarychanski R, Pisipati A, Ahern S, Kanji S, Rello J, Kumar A, 2010. Enteric absorption and pharmacokinetics of oseltamivir in critically ill patients with pandemic (H1N1) influenza. CMAJ : Canadian Medical Association journal = journal de l’Association medicale canadienne 182, 357–363. - PMC - PubMed
-
- Barr IG, Jelley LL, 2012. The coming era of quadrivalent human influenza vaccines: who will benefit? Drugs 72, 2177–2185. - PubMed
-
- Blanton L, Mustaquim D, Alabi N, Kniss K, Kramer N, Budd A, Garg S, Cummings CN, Fry AM, Bresee J, Sessions W, Garten R, Xu X, Elal AI, Gubareva L, Barnes J, Wentworth DE, Burns E, Katz J, Jernigan D, Brammer L, 2017. Update: Influenza Activity - United States, October 2, 2016-February 4, 2017. MMWR. Morbidity and mortality weekly report 66, 159–166. - PMC - PubMed
-
- Bosma MJ, Carroll AM, 1991. The SCID mouse mutant: definition, characterization, and potential uses. Annual review of immunology 9, 323–350. - PubMed
MeSH terms
Substances
Grants and funding
LinkOut - more resources
Full Text Sources
Other Literature Sources
