

AnatomiCuts: Hierarchical clustering of tractography streamlines based on anatomical similarity
- PMID: 29100937
- PMCID: PMC6152885
- DOI: 10.1016/j.neuroimage.2017.10.058
AnatomiCuts: Hierarchical clustering of tractography streamlines based on anatomical similarity
Abstract
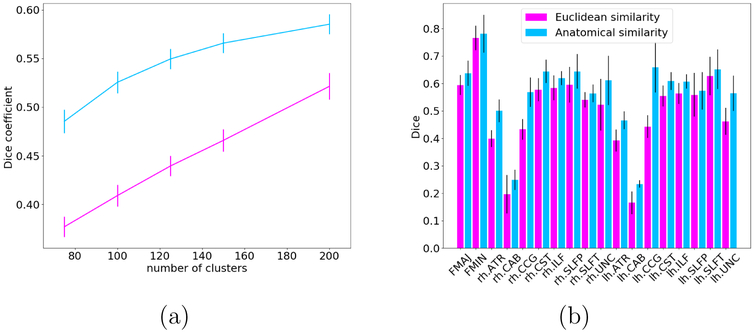
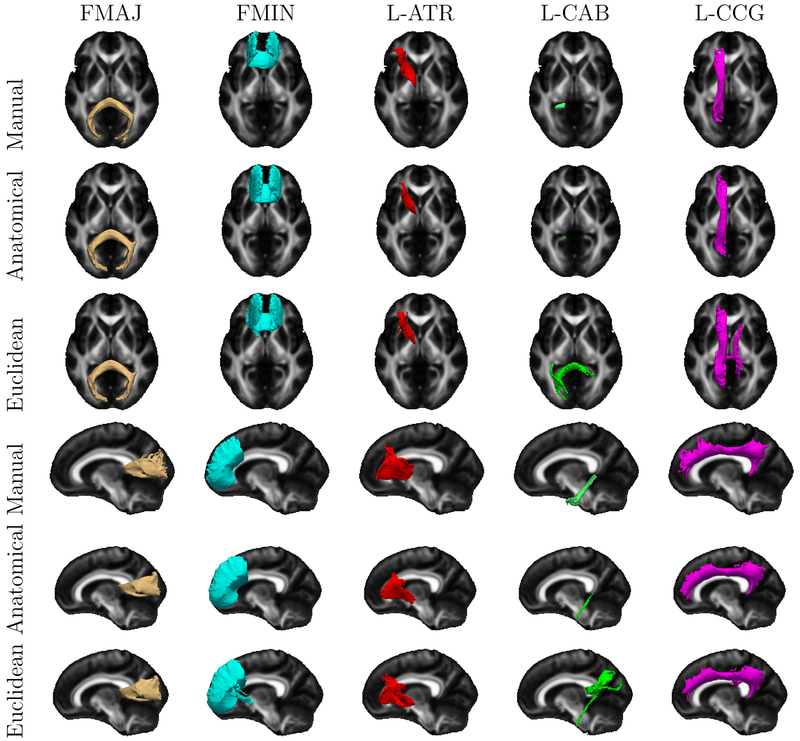
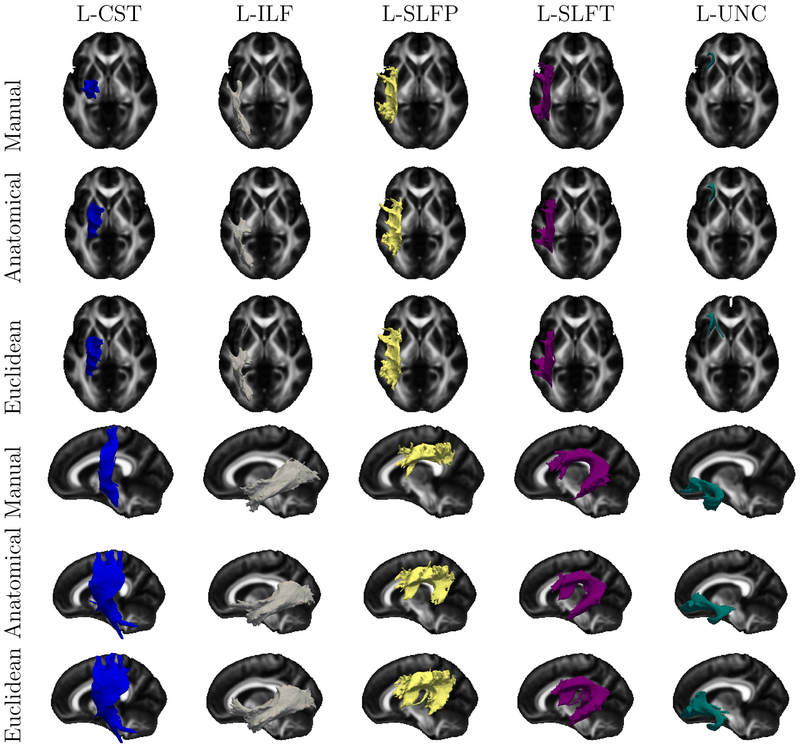
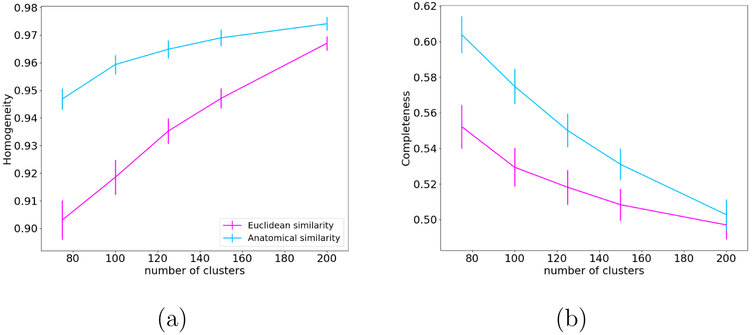
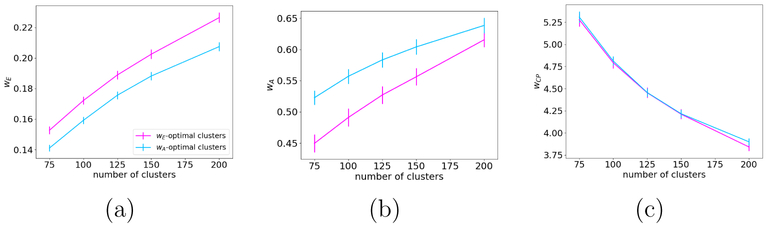
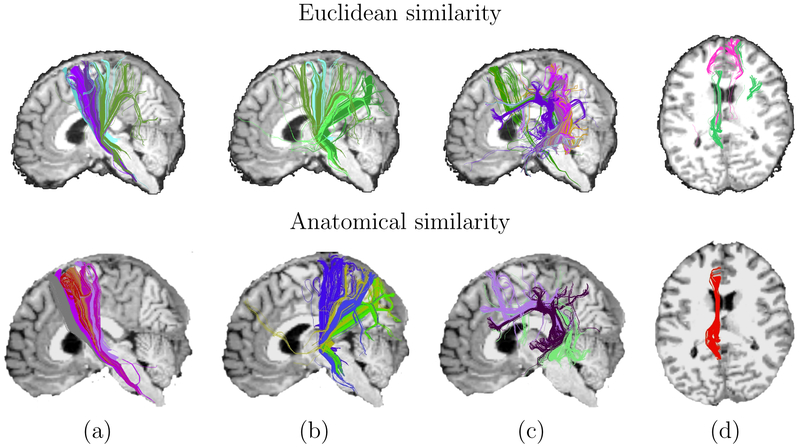
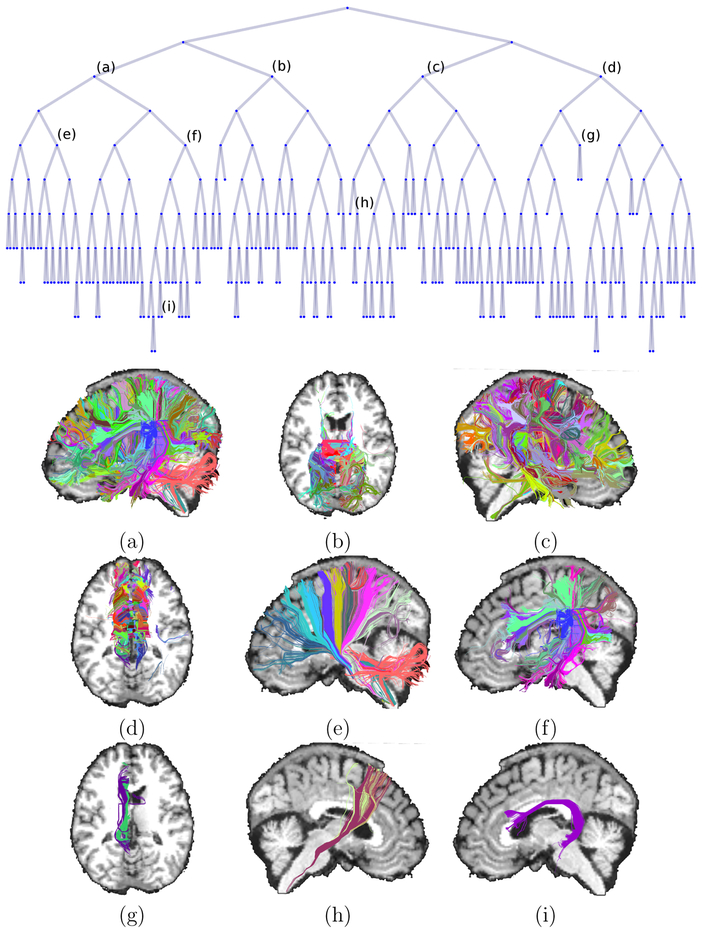
Diffusion MRI tractography produces massive sets of streamlines that contain a wealth of information on brain connections. The size of these datasets creates a need for automated clustering methods to group the streamlines into meaningful bundles. Conventional clustering techniques group streamlines based on their spatial coordinates. Neuroanatomists, however, define white-matter bundles based on the anatomical structures that they go through or next to, rather than their spatial coordinates. Thus we propose a similarity measure for clustering streamlines based on their position relative to cortical and subcortical brain regions. We incorporate this measure into a hierarchical clustering algorithm and compare it to a measure that relies on Euclidean distance, using data from the Human Connectome Project. We show that the anatomical similarity measure leads to a 20% improvement in the overlap of clusters with manually labeled tracts. Importantly, this is achieved without introducing any prior information from a tract atlas into the clustering algorithm, therefore without imposing the existence of any named tracts.
Keywords: Diffusion MRI; Hierarchical clustering; Normalized cuts; Tractography.
Copyright © 2017 Elsevier Inc. All rights reserved.
Figures
References
-
- Basser PJ, Pajevic S, Pierpaoli C, Duda J, & Aldroubi A 2000. In vivo fiber tractography using DT-MRI data. Magnetic Resonance in Medicine, 44(4), 625–632. - PubMed
-
- Corouge I, Gouttard S, & Gerig G 2004. (April). Towards a shape model of white matter fiber bundles using diffusion tensor MRI. Pages 344–347 Vol. 1 of: 2004 2nd IEEE International Symposium on Biomedical Imaging: Nano to Macro (IEEE Cat No. 04EX821).
-
- Dice LR 1945. Measures of the Amount of Ecologic Association Between Species. Ecology, 26(3), 297–302.
-
- Ding Z, Gore JC, & Anderson AW 2003. Classification and quantification of neuronal fiber pathways using diffusion tensor MRI. Magnetic Resonance in Medicine, 49(4), 716–721. - PubMed
Publication types
MeSH terms
Grants and funding
- U01 MH093765/MH/NIMH NIH HHS/United States
- R01 NS070963/NS/NINDS NIH HHS/United States
- U01 NS086625/NS/NINDS NIH HHS/United States
- R21 EB018907/EB/NIBIB NIH HHS/United States
- R01 AG016495/AG/NIA NIH HHS/United States
- R21 DK108277/DK/NIDDK NIH HHS/United States
- R01 EB021265/EB/NIBIB NIH HHS/United States
- S10 RR019307/RR/NCRR NIH HHS/United States
- R01 EB023281/EB/NIBIB NIH HHS/United States
- R01 AG008122/AG/NIA NIH HHS/United States
- U01 MH108168/MH/NIMH NIH HHS/United States
- T90 DA022759/DA/NIDA NIH HHS/United States
- R90 DA023427/DA/NIDA NIH HHS/United States
- R01 EB019956/EB/NIBIB NIH HHS/United States
- R21 NS072652/NS/NINDS NIH HHS/United States
- S10 RR023043/RR/NCRR NIH HHS/United States
- R01 NS052585/NS/NINDS NIH HHS/United States
- R01 EB006758/EB/NIBIB NIH HHS/United States
- P41 EB015896/EB/NIBIB NIH HHS/United States
- R01 NS083534/NS/NINDS NIH HHS/United States
- S10 RR023401/RR/NCRR NIH HHS/United States
LinkOut - more resources
Full Text Sources
Other Literature Sources
