. 2018 Feb 15:167:453-465.
doi: 10.1016/j.neuroimage.2017.10.037. Epub 2017 Oct 31.

Multimodal surface matching with higher-order smoothness constraints

Affiliations

Multimodal surface matching with higher-order smoothness constraints

Emma C Robinson et al. Neuroimage. .

Abstract

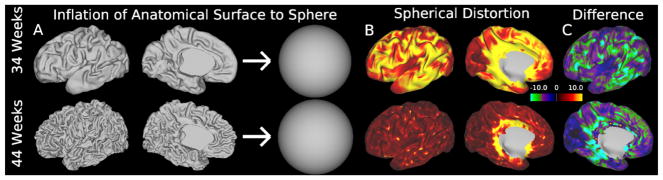
In brain imaging, accurate alignment of cortical surfaces is fundamental to the statistical sensitivity and spatial localisation of group studies, and cortical surface-based alignment has generally been accepted to be superior to volume-based approaches at aligning cortical areas. However, human subjects have considerable variation in cortical folding, and in the location of functional areas relative to these folds. This makes alignment of cortical areas a challenging problem. The Multimodal Surface Matching (MSM) tool is a flexible, spherical registration approach that enables accurate registration of surfaces based on a variety of different features. Using MSM, we have previously shown that driving cross-subject surface alignment, using areal features, such as resting state-networks and myelin maps, improves group task fMRI statistics and map sharpness. However, the initial implementation of MSM's regularisation function did not penalize all forms of surface distortion evenly. In some cases, this allowed peak distortions to exceed neurobiologically plausible limits, unless regularisation strength was increased to a level which prevented the algorithm from fully maximizing surface alignment. Here we propose and implement a new regularisation penalty, derived from physically relevant equations of strain (deformation) energy, and demonstrate that its use leads to improved and more robust alignment of multimodal imaging data. In addition, since spherical warps incorporate projection distortions that are unavoidable when mapping from a convoluted cortical surface to the sphere, we also propose constraints that enforce smooth deformation of cortical anatomies. We test the impact of this approach for longitudinal modelling of cortical development for neonates (born between 31 and 43 weeks of post-menstrual age) and demonstrate that the proposed method increases the biological interpretability of the distortion fields and improves the statistical significance of population-based analysis relative to other spherical methods.

Keywords: Biomechanical priors; Discrete optimisation; Longitudinal registration; Neonatal brain development; Surface-based cortical registration.


Figures

Figure 1
Figure 1
Areal distortions (changes in the relative spacing of vertices) occur as a result of projection from the anatomical surface to the spherical surface. These distortions change across the surfaces and between brains. Differences are particularly obvious for longitudinally acquired data. Shown here: A) White matter surfaces extracted from the same subject at 34 weeks post-menstrual age (PMA, top row) and 44 weeks PMA (bottom row) are projected to a sphere. B) Areal distortions estimated in terms of isotropic expansion of mesh faces (log2(Area2/Area1)), shown aligned and resampled to the 44 week subject (inflated brain view). C) Areal distortion difference between time points
Figure 2
Figure 2
Projecting cortical anatomy through spherical warps. The figure follows the displacement of three (yellow) points on the source white anatomical surface (SAS), via the moving source spherical surface (MSS), into a new configuration on the target white anatomical surface (TAS), where source and target represent the left hemispheres of two different subjects aged 38±1 week PMA. Steps: a) Vertex correspondence between the source sphere (SSS) and anatomy (SAS) means that points form triplets on both surfaces; b) Control-point grids (G, red) constrain the deformation of SSS within a discrete optimisation scheme (orange box). c) Each control-point (blue dot) can move to a finite number of possible positions on the surface (purple crosses). The optimal displacement (blue cross) improves feature map similarity whilst constraining deformations to be smooth; d) The displaced spherical surface configuration MSS is estimated from G using barycentric interpolation (Eq. 7); e) Barycentric correspondences are learnt between vertices on MSS (yellow dots) and TSS (pink crosses; Eq. 9); f) Weights (calculated during step e) are applied to the equivalent points on the target anatomical surface TAS (Eq. 10); creating g) a deformed anatomical surface configuration (DAS), which has the mesh topology of the source surface, but the shape of the target anatomical surface (TAS). Through this a transformation F can be estimated between SAS and DAS.
Figure 3
Figure 3
Comparison of group Z-statistic spatial maps following folding alignment (MSMSulc, run with sMSMSTR) and alignment driven my multimodal features (MSMAll, run with sMSMSTR and sMSMPAIR, matched for peak strains) for: a) a working-memory contrast (2BK) and b) a language task (Story). White boxes highlight improvements in sharpness of the contrast in the areas of the Dorsal Lateral Pre-Frontal cortex (A); region 55b (B) and in the temporal lobe (B)
Figure 4
Figure 4
Histogram plots comparing MSMAll distortions, plotted against log2 J (left) and log2 R (right). sMSMPAIR registration generates long tailed distributions with excessive peak distortions
Figure 5
Figure 5
Bar chart of mean cluster mass statistics across HCP task categories for different methods. Note, only pure contrasts are included, that is direct response to individual tasks not differences in activations between tasks.
Figure 6
Figure 6
Mean edge distortion maps, averaged across all surfaces. Top row) distortions for folding based alignment only, pink boxes highlight hot spots of edge distortions for SD method; Bottom row) multimodal (MM) alignments: MSM Pair Mean (MSMAll run with sMSMPAIR optimised to achieve comparable mean strains to sMSMSTR); MSM Pair Peak (MSMAll run with sMSMPAIR optimised to achieve comparable peak strains to sMSMSTR; MSM Strain (MSMAll run with sMSMSTR)
Figure 7
Figure 7
Comparison of surface geometry (a), cortical labels (b) and curvature maps (c) for one exemplar data set (top=TP1, bottom=TP2)
Figure 8
Figure 8
Cumulative distribution functions of Loĝ2J and Loĝ2R. for different methods: sMSMPAIR (red); SD (green); sMSMSTR (blue); aMSMSTR (black). Functions are estimated from the full distribution of strain values estimated by combining per-vertex strain values across all 10 deformations.
Figure 9
Figure 9
Alignment quality of longitudinal warps, assessed through feature map cross correlation and Dice Overlap (averaged across 16 cortical regions). Colour as for Fig. 8
Figure 10
Figure 10
Comparison of distortion fields across subjects. Left: Loĝ2J relative areal distortion averaged across all 10 neonatal subjects in template space; Right: p-values for statistical comparison, thresholded at p < 0.05

References

    1. Abdollahi RO, Kolster H, Glasser MF, Robinson EC, Coalson TS, Dierker D, Jenkinson M, Van Essen DC, Orban GA. Correspondences between retinotopic areas and myelin maps in human visual cortex. Neuroimage. 2014;99:509–524. - PMC - PubMed
    1. Amunts K, Malikovic A, Mohlberg H, Schormann T, Zilles K. Brodmann’s areas 17 and 18 brought into stereotaxic spacewhere and how variable? Neuroimage. 2000;11(1):66–84. - PubMed
    1. Amunts K, Schleicher A, Zilles K. Cytoarchitecture of the cerebral cortex - more than localization. NeuroImage. 2007;37(4):1061–1065. - PubMed
    1. Artaechevarria X, Munoz-Barrutia A, Ortiz-de Solórzano C. Combination strategies in multi-atlas image segmentation: Application to brain mr data. IEEE transactions on medical imaging. 2009;28(8):1266–1277. - PubMed
    1. Barch DM, Burgess GC, Harms MP, Petersen SE, Schlaggar BL, Corbetta M, Glasser MF, Curtiss S, Dixit S, Feldt C, et al. Function in the human connectome: Task-fMRI and individual differences in behavior. NeuroImage. 2013;80:169–189. - PMC - PubMed

Publication types

MeSH terms