. 2018 Feb;8(2):196-215.
doi: 10.1158/2159-8290.CD-17-0833. Epub 2017 Nov 3.

Ex Vivo Profiling of PD-1 Blockade Using Organotypic Tumor Spheroids

Russell W Jenkins  1   2 Amir R Aref  1   3 Patrick H Lizotte  1   3 Elena Ivanova  1   3 Susanna Stinson  4 Chensheng W Zhou  1   5 Michaela Bowden  1   5 Jiehui Deng  1 Hongye Liu  1   3   6 Diana Miao  1   7 Meng Xiao He  1   7   8 William Walker  1   3 Gao Zhang  9 Tian Tian  10 Chaoran Cheng  10 Zhi Wei  10 Sangeetha Palakurthi  1   3 Mark Bittinger  1   3 Hans Vitzthum  2 Jong Wook Kim  1   7 Ashley Merlino  1 Max Quinn  1 Chandrasekar Venkataramani  4 Joshua A Kaplan  4 Andrew Portell  1   3 Prafulla C Gokhale  1   3 Bart Phillips  4 Alicia Smart  1   7 Asaf Rotem  1 Robert E Jones  1   3 Lauren Keogh  1   3 Maria Anguiano  11 Lance Stapleton  4 Zhiheng Jia  4 Michal Barzily-Rokni  2 Israel Cañadas  1 Tran C Thai  1 Marc R Hammond  2 Raven Vlahos  1   5 Eric S Wang  12 Hua Zhang  1 Shuai Li  1 Glenn J Hanna  1 Wei Huang  1   3 Mai P Hoang  13 Adriano Piris  14 Jean-Pierre Eliane  13 Anat O Stemmer-Rachamimov  13 Lisa Cameron  15 Mei-Ju Su  1 Parin Shah  1 Benjamin Izar  1   7 Manisha Thakuria  1   16 Nicole R LeBoeuf  1   16 Guilherme Rabinowits  1 Viswanath Gunda  17 Sareh Parangi  17 James M Cleary  1 Brian C Miller  1 Shunsuke Kitajima  1 Rohit Thummalapalli  1 Benchun Miao  2 Thanh U Barbie  18 Vivek Sivathanu  19 Joshua Wong  1 William G Richards  20 Raphael Bueno  20 Charles H Yoon  18 Juan Miret  1   3 Meenhard Herlyn  9 Levi A Garraway  1 Eliezer M Van Allen  1   7 Gordon J Freeman  1 Paul T Kirschmeier  1   3 Jochen H Lorch  1 Patrick A Ott  1 F Stephen Hodi  1 Keith T Flaherty  2 Roger D Kamm  19   21 Genevieve M Boland  17 Kwok-Kin Wong  1   3 David Dornan  22 Cloud Peter Paweletz  23   3 David A Barbie  23
Affiliations

Ex Vivo Profiling of PD-1 Blockade Using Organotypic Tumor Spheroids

Russell W Jenkins et al. Cancer Discov. 2018 Feb.

Abstract

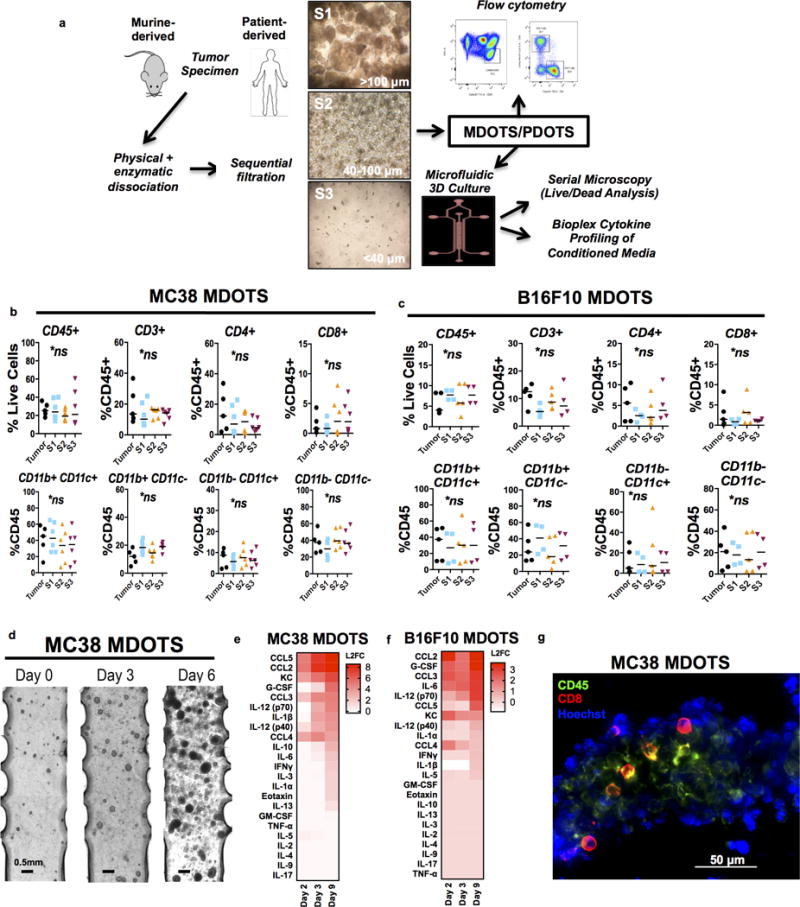
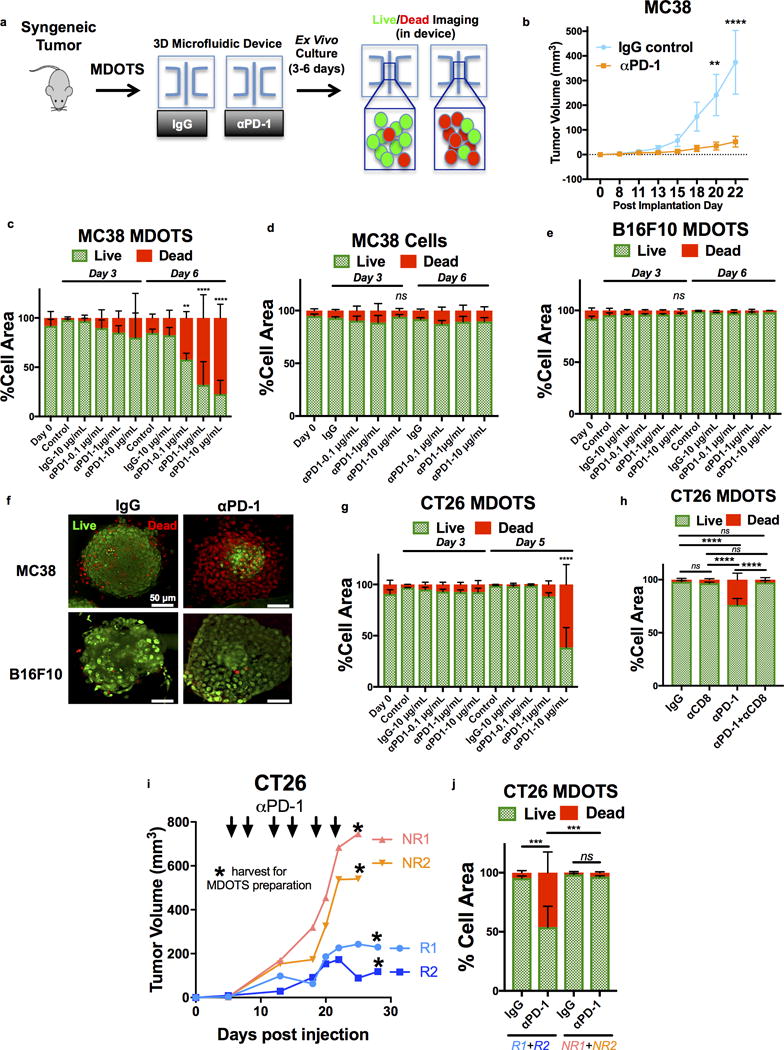
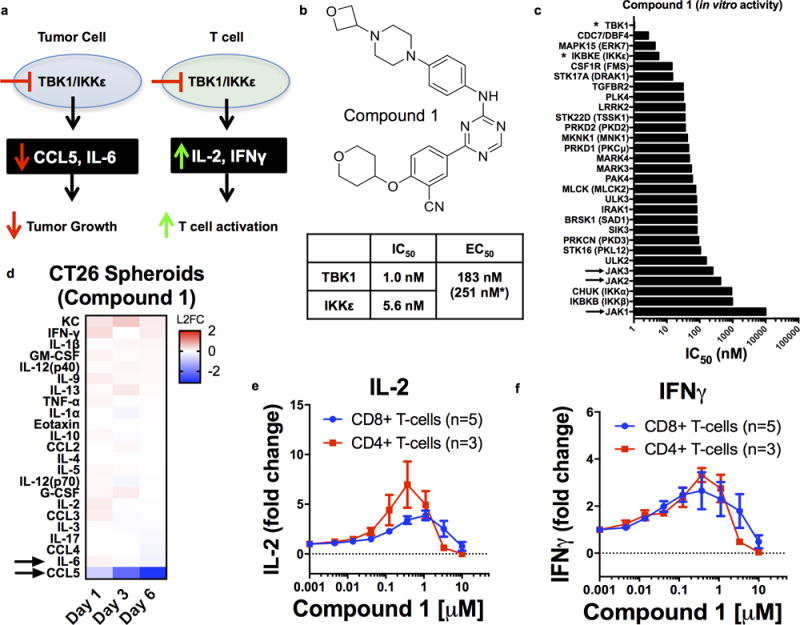
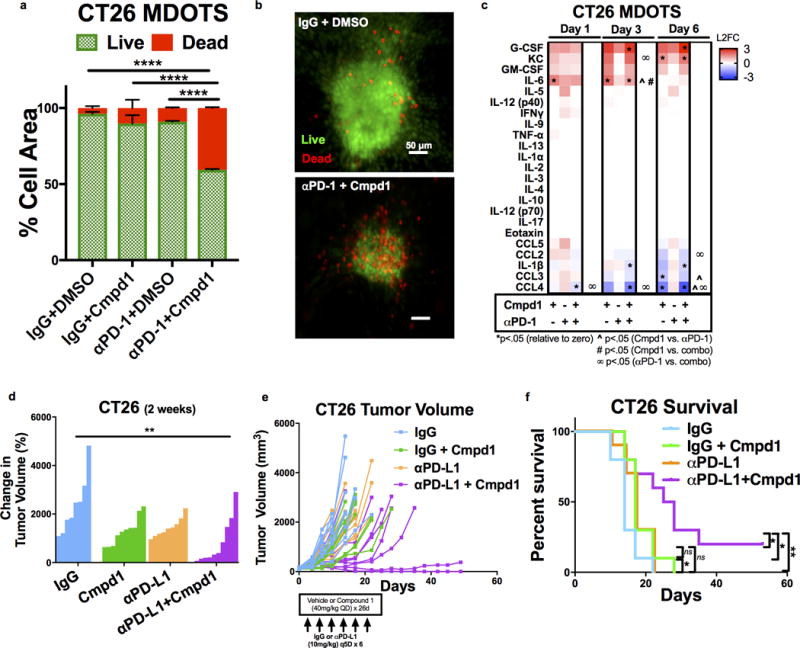
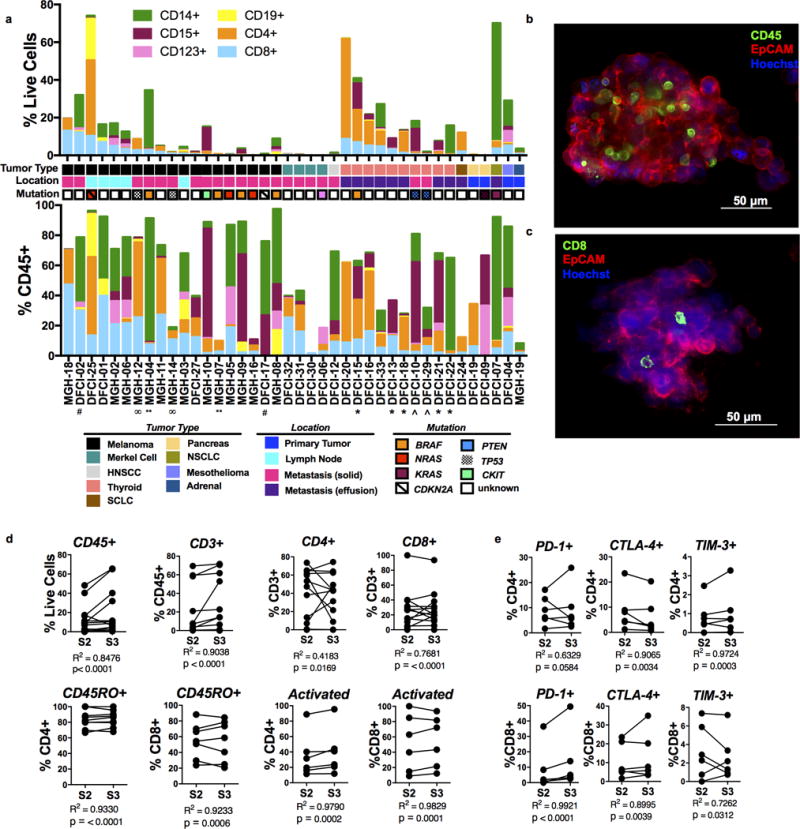
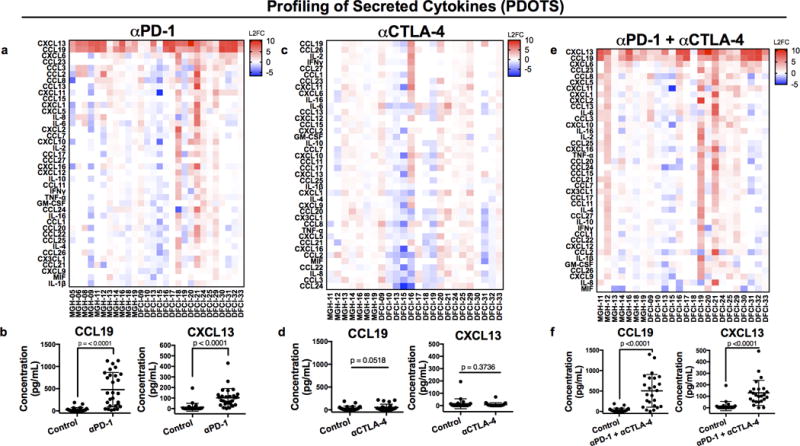
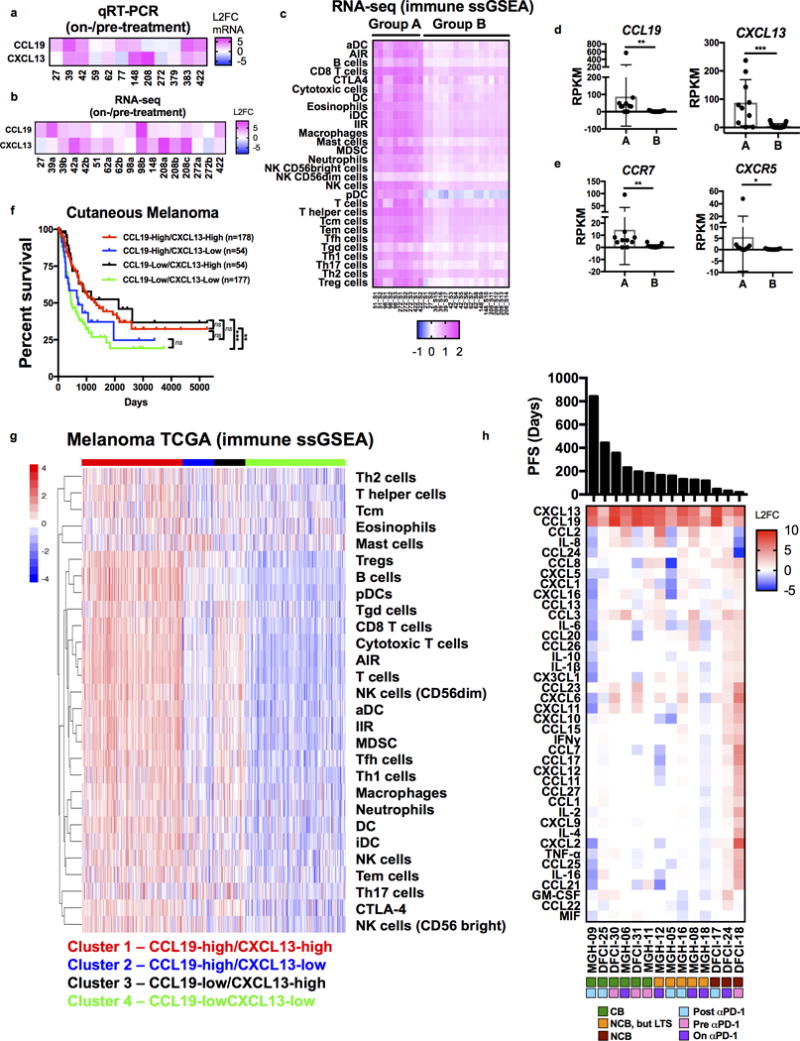
Ex vivo systems that incorporate features of the tumor microenvironment and model the dynamic response to immune checkpoint blockade (ICB) may facilitate efforts in precision immuno-oncology and the development of effective combination therapies. Here, we demonstrate the ability to interrogate ex vivo response to ICB using murine- and patient-derived organotypic tumor spheroids (MDOTS/PDOTS). MDOTS/PDOTS isolated from mouse and human tumors retain autologous lymphoid and myeloid cell populations and respond to ICB in short-term three-dimensional microfluidic culture. Response and resistance to ICB was recapitulated using MDOTS derived from established immunocompetent mouse tumor models. MDOTS profiling demonstrated that TBK1/IKKε inhibition enhanced response to PD-1 blockade, which effectively predicted tumor response in vivo Systematic profiling of secreted cytokines in PDOTS captured key features associated with response and resistance to PD-1 blockade. Thus, MDOTS/PDOTS profiling represents a novel platform to evaluate ICB using established murine models as well as clinically relevant patient specimens.Significance: Resistance to PD-1 blockade remains a challenge for many patients, and biomarkers to guide treatment are lacking. Here, we demonstrate feasibility of ex vivo profiling of PD-1 blockade to interrogate the tumor immune microenvironment, develop therapeutic combinations, and facilitate precision immuno-oncology efforts. Cancer Discov; 8(2); 196-215. ©2017 AACR.See related commentary by Balko and Sosman, p. 143See related article by Deng et al., p. 216This article is highlighted in the In This Issue feature, p. 127.


Conflict of interest statement

The authors declare no competing interests.

Figures

Figure 1
Figure 1. Immune profiling and ex vivo culture of murine-derived organotypic tumor spheroids
a, Schematic for preparation and analysis of MDOTS/PDOTS (S2 fraction) from murine or patient-derived tumor specimens. b, MC38 immune profiling by flow cytometry comparing bulk tumor (n=5) to S1, S2, S3 (n=6) spheroid fractions (Kruskal-Wallis with Dunn’s multiple comparisons test, α=0.05; ns=not significant). c, B16F10 immune profiling by flow cytometry comparing bulk tumor (n=5) to S1 (n=4), S2 (n=5), and S3 (n=4) evaluated by flow cytometry (Kruskal-Wallis test with Dunn’s multiple comparisons test, α=0.05; p<.05; ns=not significant). d, Phase-contrast imaging (4×) of MC38 MDOTS in 3D microfluidic culture. e–f, Heatmaps of secreted cytokine profiles from cultured (e) MC38 and (f) B16F10 MDOTS expressed as log-2 fold change relative to Day 1. g, Immunofluorescence staining of CD45+ and CD8+ immune cells in MC38 MDOTS.
Figure 2
Figure 2. Ex vivo profiling of PD-1 blockade using MDOTS
a, Schematic of MDOTS Live/Dead Imaging workflow. b, MC38 implanted tumor volume following isotype control IgG (n=10) or rat-anti-mouse anti-PD-1 antibody (n=10) treatment (mean ± s.e.m., 2-way ANOVA, Sidak’s multiple comparison test, **p<.01, ****p<0.0001). c, Live (AO = green)/dead (PI = red) quantification of MC38 MDOTS Day 0 (immediately after loading), Day 3, and Day 6 following IgG control or indicated anti-PD-1 antibody doses (n=4, biological replicates, 2-way ANOVA with Dunnett’s with multiple comparisons test, **p<.01, ****p<0.0001). d, Live/dead analysis of MC38 spheroids lacking immune cells ± anti-PD1 (n=4, biological replicates). e, Live/dead analysis of B16F10 MDOTS ± anti-PD1 (n=3, biological replicates). f, Deconvolution fluorescence microscopy of MC38 and B16F10 MDOTS Day 6 ± anti-PD1 (representative images shown). g, Live/dead analysis of CT26 MDOTS ± anti-PD1 (n=3, biological replicates, 2-way ANOVA with Dunnett’s with multiple comparisons test; ****p<0.0001). h, Live/dead analysis of CT26 MDOTS performed on Day 6 following treatment with isotype IgG control (10 μg/mL) or anti-PD-1 (10 μg/mL) ± anti-CD8 (10 μg/mL) (n=6, biological replicates; 2-way ANOVA with Tukey’s multiple comparisons test; ****p<.0001, ns = not significant). i, CT26 tumor volumes for responder (R1+R2) and non-responder (NR1+NR2) Balb/c mice treated with anti-PD-1 (10mg/kg twice weekly × 6 doses, starting at Day 5) with time of tumor harvest for MDOTS preparation indicated (*). j, Live/dead analysis (Day 6) of CT26 MDOTS from responder and non-responder mice following ex vivo treatment with isotype IgG control (10 μg/mL) or anti-PD-1 (10 μg/mL) (n=3, biological replicates; 2-way ANOVA with Tukey’s multiple comparisons test; ***p<.001, ns = not significant).
Figure 3
Figure 3. Characterization of Compound 1, a Novel TBK1/IKKε inhibitor
a, Scheme of impact of TBK1/IKKε inhibition on cytokine production from tumor cells and T cells. b, Compound 1 chemical structure with IC50 towards TBK1/IKKε, and EC50 in HCT116 cells. c, IC50 values for indicated enzymes treated with Compound 1. d, Cytokine heatmaps for CT26 spheroids (lacking immune cells) on Day 1, 3, and 6 ± Compound 1 (n=3, biological replicates) expressed as log2 fold-change (L2FC) relative to vehicle control. e–f, Dose-response curves for Compound 1 on IL-2 (e) and IFNγ (f) in human CD4 (n=3) and CD8 (n=5) T cells.
Figure 4
Figure 4. TBK1/IKKε inhibition enhances response to PD-1 blockade
a–b, Live (AO = green)/dead (PI = red) quantification of CT26 MDOTS after 6 days treated with IgG-DMSO, Cmpd1 (1μM), αPD-1, and αPD-1+ Cmpd1 (*p<0.05, Kruskal-Wallis ANOVA with multiple comparisons; n=3). c, Cytokine heatmaps for CT26 MDOTS treated with IgG+Cmpd1 (1μM), αPD-1 (10 μg/mL), or αPD-1+Cmpd1 (1μM) from the mean of n=3 biological replicates, plotted as L2FC relative to isotype control IgG with vehicle control. 2-sided Welch’s 2-sample t-test with unequal variance (α=.05). d-f, CT26 implanted tumor volume (d-e) and percent survival (f) following IgG+vehicle, IgG+Cmpd1, αPD-L1+vehicle, and αPD-L1+Cmpd1 (n=10 per group, **p<.01, 1-way ANOVA with Tukey’s multiple comparison’s test for tumor volume, log-rank Mantel-Cox test for Kaplan-Meier analysis for entire group and pairwise comparisons).
Figure 5
Figure 5. Immune profiling of patient-derived organotypic tumor spheroids
a, Immune profiling of PDOTS (S2; n=40) (upper panel = % live cells, lower panel = %CD45+ cells) with indicated patient/tumor characteristics, grouped by tumor type and ranked by %CD8+ T cells. b–c, Immunofluorescence staining identifying (b) CD45+ immune cells and (c) CD8+ T cells with EpCAM+ cancer cells NSCLC PDOTS. d, Immune cell correlation of S2/S3 fractions (CD45, n=14; CD3, n=15; CD4/CD8, n=13; CD4+CD45RO+, n=9; CD8+CD45RO+, n=8; activated = CD38+ and/or CD69+, n=6), R2 significant for all comparisons. e, PD-1, CTLA-4, TIM-3 expression on CD4 and CD8 T cell populations in S2/S3 fractions (n=6), R2 significant for all comparisons.
Figure 6
Figure 6. Cytokine profiling of PD-1 blockade in PDOTS reveals CCL19/CXCL13 upregulation
Cytokine heatmaps Day 3 ± anti-PD-1 (a, n=28), anti-CTLA-4 (c, n=24), or anti-PD-1 + anti-CTLA-4 (e, n=24) expressed as log2 fold-change (L2FC) relative to untreated control. Absolute CCL19/CXCL13 levels (pg/mL) observed at Day 3 ± anti-PD-1 (b, n=28), anti-CTLA-4 (d, n=24), or anti-PD-1 + anti-CTLA-4 (f, n=24) (2-sided, paired, t-test, α= 0.05).
Figure 7
Figure 7. CCL19/CXCL13 induction following PD-1 treatment and association with immune infiltration
a–b, CCL19/CXCL13 mRNA levels from melanoma biopsy samples on anti-PD1 treatment relative to pre-PD-1 (L2FC) by (a) qRT-PCR (n=12) and (b) RNA-seq (n=17 from 10 patients). c, Immune signatures (ssGSEA) in melanoma biopsy specimens (pre- and on-treatment) define immune-infiltrated (Group A, n=10 samples from 4 patients) and immune-poor tumor samples (Group B, n=17 samples from 6 patients). d–e, absolute expression (RPKM) for (d) CCL19 and CXCL13 and (e) their respective receptors, CCR7 and CXCR5 in melanoma biopsy specimens (pre- and on-treatment) in indicated sets of patient samples (group A - immune infiltrated; group B – immune poor by ssGSEA, Fig. 7c). f, Kaplan-Meier survival curve by four-way sorting of CCL19/CXCL13 expression using cutaneous melanoma (SKCM) TCGA data (38) (log-rank Mantel-Cox test). g, immune signatures (ssGSEA) in melanoma biopsy specimens (pre- and on-treatment) in clusters of patients with varying expression of CCL19 and CXCL13 in cutaneous melanoma (SKCM) TCGA. h, Heatmap of Day 3 PDOTS anti-PD1 induced cytokines (L2FC; n=14), ranked by progression-free survival (PFS) and annotated by response to anti-PD-1 therapy (CB, NCB/LTS, or NCB) and timing of sample collection.

Comment in

Similar articles

Cited by

References

    1. Topalian SL, Drake CG, Pardoll DM. Immune checkpoint blockade: a common denominator approach to cancer therapy. Cancer Cell. 2015;27:450–61. - PMC - PubMed
    1. Pardoll DM. The blockade of immune checkpoints in cancer immunotherapy. Nat Rev Cancer. 2012;12:252–64. - PMC - PubMed
    1. Sharma P, Hu-Lieskovan S, Wargo JA, Ribas A. Primary, Adaptive, and Acquired Resistance to Cancer Immunotherapy. Cell. 2017;168:707–23. - PMC - PubMed
    1. Ribas A, Hamid O, Daud A, Hodi FS, Wolchok JD, Kefford R, et al. Association of Pembrolizumab With Tumor Response and Survival Among Patients With Advanced Melanoma. JAMA. 2016;315:1600–9. - PubMed
    1. Schadendorf D, Hodi FS, Robert C, Weber JS, Margolin K, Hamid O, et al. Pooled Analysis of Long-Term Survival Data From Phase II and Phase III Trials of Ipilimumab in Unresectable or Metastatic Melanoma. J Clin Oncol. 2015;33:1889–94. - PMC - PubMed

Publication types

Substances