. 2018 Jan 19;293(3):754-766.
doi: 10.1074/jbc.M117.813493. Epub 2017 Nov 3.

NMR-directed design of pre-TCRβ and pMHC molecules implies a distinct geometry for pre-TCR relative to αβTCR recognition of pMHC

Affiliations

NMR-directed design of pre-TCRβ and pMHC molecules implies a distinct geometry for pre-TCR relative to αβTCR recognition of pMHC

Robert J Mallis et al. J Biol Chem. .

Abstract

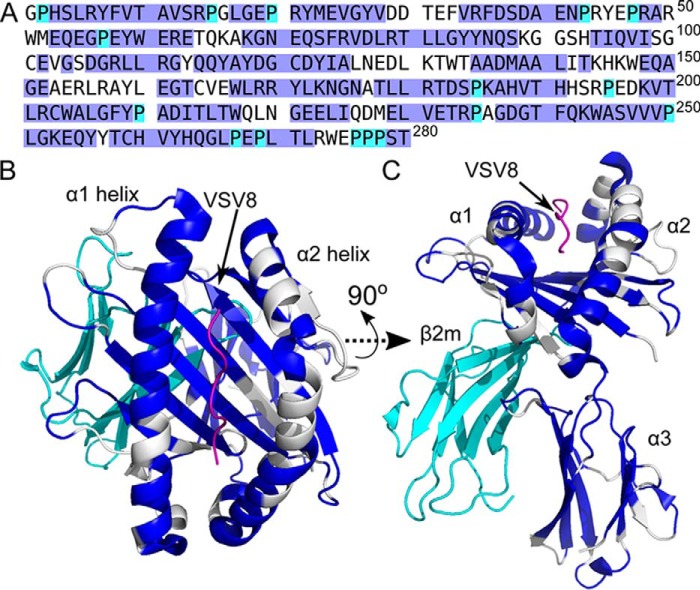
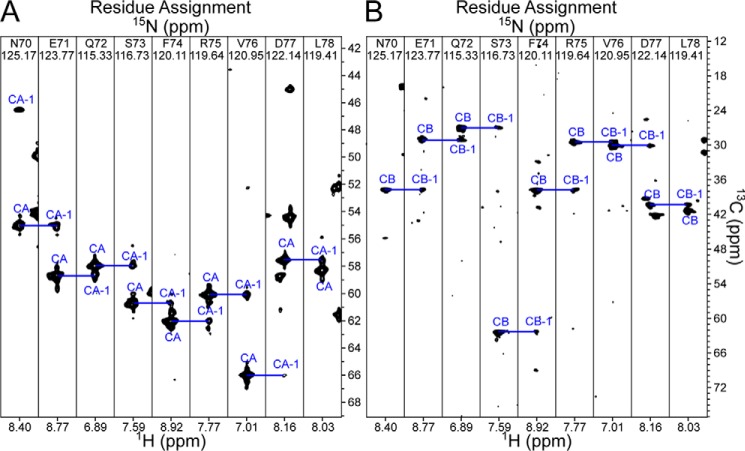
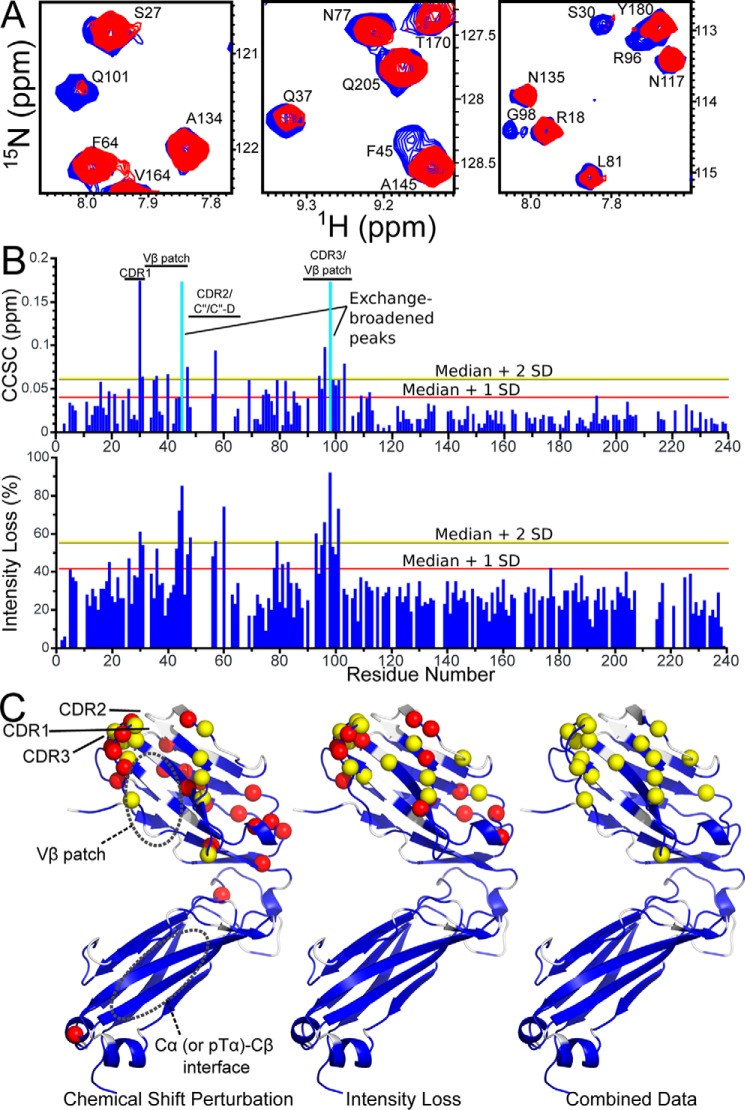
The pre-T cell receptor (pre-TCR) guides early thymocytes through maturation processes within the thymus via interaction with self-ligands displayed on thymic epithelial cells. The pre-TCR is a disulfide-linked heterodimer composed of an invariant pre-TCR α (pTα) subunit and a variable β subunit, the latter of which is incorporated into the mature TCR in subsequent developmental progression. This interaction of pre-TCR with peptide-major histocompatibility complex (pMHC) molecules has recently been shown to drive robust pre-TCR signaling and thymocyte maturation. Although the native sequences of β are properly folded and suitable for NMR studies in isolation, a tendency to self-associate rendered binding studies with physiological ligands difficult to interpret. Consequently, to structurally define this critical interaction, we have re-engineered the extracellular regions of β, designated as β-c1, for prokaryotic production to be used in NMR spectroscopy. Given the large size of the full extracellular domain of class I MHC molecules such as H-Kb, we produced a truncated form termed Kb-t harboring properties favorable for NMR measurements. This system has enabled robust measurement of a pre-TCR-pMHC interaction directly analogous to that of TCRαβ-pMHC. Binding surface analysis identified a contact surface comparable in size to that of the TCRαβ-pMHC but potentially with a rather distinct binding orientation. A tilting of the pre-TCRβ when bound to the pMHC ligand recognition surface versus the upright orientation of TCRαβ would alter the direction of force application between pre-TCR and TCR mechanosensors, impacting signal initiation.

Keywords: T-cell receptor (TCR); immunology; major histocompatibility complex (MHC); nuclear magnetic resonance (NMR); protein domain; protein folding.


Conflict of interest statement

The authors declare that they have no conflicts of interest with the contents of this article

Figures

Figure 1.
Figure 1.
Interaction of TCRβ with pMHC via C domain. A–D, N30β (A and B) or N15β (C and D) interacts with VSV8/Kb via elements of Cβ. Schematic diagrams show residues that are impacted by addition of VSV8/Kb as spheres. A, plot of combined 1H-15N CCSC (top plot) or intensity loss (bottom plot) versus residue number upon addition of 500 μm VSV8/Kb to 200 μm 15N-labeled N30β. Cutoff values of median + 1 or 2 S.D. are indicated as are regions of largest perturbations. Residue A3 increased in intensity by 30% and is shown in cyan. B, residues that exhibit chemical shift perturbation (median + 1 S.D., red spheres; median + 2 S.D., yellow spheres) are indicated on the structure of N30β (Protein Data Bank code 3Q5T). C, plot of cross-saturation effect (Isat/Iref) versus residue with addition of 350 μm VSV8/Kb to 175 μm 2H/13C/15N-labeled N15β. Residues that exhibit significant cross-saturation effect (top 10th (yellow bars) or 25th percentile (red bars)) are highlighted. D, residues that exhibit significant cross-saturation effect (top 10th (yellow spheres) or 25th percentile (red spheres)) with addition of 350 μm VSV8/Kb to 175 μm 2H/13C/15N-labeled N15β are indicated on the structure of N15β (Protein Data Bank code 3Q5Y).
Figure 2.
Figure 2.
Mutagenesis targets within the pre-TCR β subunit. A, pre-TCR crystal structure model (Protein Data Bank code 3OF6) in schematic representation in the same orientation as Fig. 1B. B, expanded view of boxed area of A showing only TCRβ. The view is rotated ∼15° about x and y to highlight the contact surface. Side chains of residues contacting (i.e. within 4 Å of) pTα are shown in stick representation. Three hydrophobic residues targeted for mutagenesis are colored yellow. Numbering is according to that found in the crystal structure 3OF6 and is offset from those of N15 and N30β by three or two residues, respectively. C and D, overlay of 1H-15N TROSY-HSQC of N30β (18) and N30β-c1 (9) (C) or N15β (18) and N15β-c1 (9) (D) to illustrate similarity of spectra. E, region of overlaid spectra shown in C with labeled peaks indicating lack of chemical shift changes in the V domain (Thr-6, Thr-32, Asp-25, Leu-111, and Leu-117), whereas those in the C domain (Val-125, Tyr-184, Arg-189, Gln-209, and Phe-210) show significant changes. F, rotational correlation times of WT and mutant TCRβs suggest abrogation of self-association within Cβ. The plot shows τc versus concentration for N15 (blue diamonds) and N30β (red triangles). Lines show exponential fits of points to guide the eye. WT is shown with filled symbols and solid lines, and c1 mutants are shown with open symbols and dotted lines.
Figure 3.
Figure 3.
Three-dimensional correlations for backbone assignment of VSV8/Kb. A, selected regions of the HNCA experiment illustrating the quality of the spectrum for a given section within the α1 helix. B, selected regions of the HNCACB experiment for the same region as in A.
Figure 4.
Figure 4.
Backbone assignment of VSV8/Kb. A, amino acid sequence of Kb. Highlighted in blue are assigned residues. Cyan indicates the positions of unassigned Pro residues. Completeness of assignment is of 194 of 264 non-proline residues (73%). B and C, VSV8/Kb structural model (Protein Data Bank code 1KPU) with assigned residues within Kb colored blue, unassigned residues and prolines colored white, VSV8 in purple, and β2m in cyan. C is rotated by 90° about the x axis relative to B.
Figure 5.
Figure 5.
Interaction of VSV8/Kb with N15β-c1. A, CCSC (top) or intensity loss (bottom) of 15N-labeled Kb within VSV8/Kb complex using data published in Mallis et al. (9) wherein 200 (dark blue), 500 (blue), or 750 (cyan) μm N15β-c1 was added to 200 μm VSV8/Kb. Residues that differ at the p < 0.01 (**) or p < 0.05 (*) level between the measured value for that residue and the median value for each experiment are indicated. B, residues with significant changes from median values of chemical shift changes (top row) or intensity losses (bottom row) depicted in A are shown as yellow spheres on the structural model of VSV8/Kb.
Figure 6.
Figure 6.
Three-dimensional correlations for backbone assignment of VSV8/Kb-t. A, selected regions of the HNCA experiment illustrating the quality of the spectrum for a given section within the α1 helix. B, selected regions of the HNCACB experiment for the same region as in A. The same residues were used here as in Fig. 3.
Figure 7.
Figure 7.
Backbone assignment of VSV8/Kb-t. A, amino acid sequence of Kb-t. Highlighted in blue are assigned residues. Cyan indicates the positions of unassigned Pro residues. Completeness of assignment is 78% non-proline residues. B and C, VSV8/Kb structural model (Protein Data Bank code 1KPU) with assigned residues within Kb colored blue, unassigned residues in white, prolines in cyan, and VSV8 in purple. C is rotated by 90° about the x axis relative to B.
Figure 8.
Figure 8.
N15β-c1 binding to VSV8/Kb-t. A, selected regions of 1H-15N TROSY-HSQC spectra highlighting changes with addition of unlabeled VSV8/Kb-t to 15N-labeled N15β-c1. Spectral regions measuring 200 μm 15N-labeled N15β-c1 (blue) are overlaid with those measuring 200 μm 15N-labeled N15β-c1 + 200 μm VSV8/Kb-t (red). CDR residues Ser-30, Arg-96, Gly-98, and Gln-101 as well as Vβ patch residues Gln-37 and Phe-45 are shown exhibiting chemical shift changes, intensity changes, or both. B, CCSC (upper panel) or intensity losses (lower panel) versus residue number for spectra outlined in A. Residues in which exchange broadening made accurate determination of peak position impossible are indicated by a cyan bar in the upper panel. Lines indicating statistical cutoffs used in structural mapping are shown. C, schematic representation of N15β-c1 showing chemical shift perturbation (left), intensity loss (center), or combined data showing residues two S.D. from median in either measure (right). Assigned residues are colored blue, and unassigned residues are white. Significantly perturbed residues differing from the median by twice the S.D. are highlighted as yellow spheres, and those that differ by one S.D. are shown as red spheres.
Figure 9.
Figure 9.
NMR detection of interaction between N15β-c1 and VSV8/Kb-t. A, selected regions of 1H-15N TROSY-HSQC spectra highlighting changes with addition of unlabeled N15β-c1 to 15N-labeled VSV8/Kb-t. Spectra are overlaid for VSV8/Kb-t alone (red) and with addition of 200 (pink), 300 (lavender), or 500 (blue) μm N15β-c1. B, CCSCs for spectra outlined in A for 200 (dark blue), 300 (blue), or 500 (cyan) μm N15β-c1. Residues that differ at the p < 0.01 (**) or p < 0.05 (*) level between the CCSC for that residue and the median CCSC for each experiment are indicated. C and D, schematic representation of VSV8/Kb-t with assigned residues colored blue, unassigned residues in white, prolines in cyan, and VSV8 in purple. Significantly perturbed residues by CCSC at p < 0.01 are highlighted as red spheres, and those that differ at p < 0.05 are shown as orange spheres. Residue identities are indicated. D, view rotated by 90° about the x and y axes relative to C with the α2 helix proximal.
Figure 10.
Figure 10.
Modeling pre-TCR–pMHC complex. A–C, location of residues participating in interaction with N15β in the N15β-VSV8/Kb X-ray structure (30). A, interacting residues indicated by red spheres were defined by CCSC differing at the p < 0.01 level between the CCSC for that residue and the median CCSC for each experiment. The VSV8/Kb-t structure is depicted with assigned residues colored blue, unassigned residues as well as α3 and β2m subunits not present in this construct colored white, and VSV8 in purple. B and C are zoomed in to highlight the interaction site with α2 proximal in B and rotated 180° about the y axis and α1 proximal in C. D, three representative conformers of N15β-c1 interacting with VSV8/Kb as determined by molecular modeling using CST data for the N15β-c1 interaction surface (9) and VSV8/Kb-t CCSC data (Fig. 9) as ambiguous restraints input for HADDOCK2.2 (31). The conformers are representative of the three lowest-energy clusters of binding conformations and are color-coded with one shown as van der Waals surface representation and two shown in ribbon. The Cβ domain membrane-proximal end for each conformer is indicated with a color-coded “C.” The models are aligned by overlay of the pMHC, shown in gray schematic with α1 and α2 labeled. E, side view with only conformer 1 of β shown and differing by a rotation of 90° about the x axis relative to D. VSV8/Kb-t is in the same approximate orientation as VSV8/Kb shown in A with α2 facing front.

Similar articles

Cited by

References

    1. Kim S. T., Takeuchi K., Sun Z.-Y., Touma M., Castro C. E., Fahmy A., Lang M. J., Wagner G., and Reinherz E. L. (2009) The αβ T cell receptor is an anisotropic mechanosensor. J. Biol. Chem. 284, 31028–31037 10.1074/jbc.M109.052712 - DOI - PMC - PubMed
    1. Liu B., Chen W., Evavold B. D., and Zhu C. (2014) Accumulation of dynamic catch bonds between TCR and agonist peptide-MHC triggers T cell signaling. Cell 157, 357–368 10.1016/j.cell.2014.02.053 - DOI - PMC - PubMed
    1. Brazin K. N., Mallis R. J., Das D. K., Feng Y., Hwang W., Wang J.-H., Wagner G., Lang M. J., and Reinherz E. L. (2015) Structural features of the αβTCR mechanotransduction apparatus that promote pMHC discrimination. Front. Immunol. 6, 441 10.3389/fimmu.2015.00441 - DOI - PMC - PubMed
    1. Das D. K., Feng Y., Mallis R. J., Li X., Keskin D. B., Hussey R. E., Brady S. K., Wang J.-H., Wagner G., Reinherz E. L., and Lang M. J. (2015) Force-dependent transition in the T-cell receptor β-subunit allosterically regulates peptide discrimination and pMHC bond lifetime. Proc. Natl. Acad. Sci. U.S.A. 112, 1517–1522 10.1073/pnas.1424829112 - DOI - PMC - PubMed
    1. Liu Y., Blanchfield L., Ma V. P., Andargachew R., Galior K., Liu Z., Evavold B., and Salaita K. (2016) DNA-based nanoparticle tension sensors reveal that T-cell receptors transmit defined pN forces to their antigens for enhanced fidelity. Proc. Natl. Acad. Sci. U.S.A. 113, 5610–5615 10.1073/pnas.1600163113 - DOI - PMC - PubMed

Publication types

MeSH terms

Substances

LinkOut - more resources