. 2018 Jan;176(1):865-878.
doi: 10.1104/pp.16.01982. Epub 2017 Nov 3.

Arabidopsis Novel Glycine-Rich Plasma Membrane PSS1 Protein Enhances Disease Resistance in Transgenic Soybean Plants

Affiliations

Arabidopsis Novel Glycine-Rich Plasma Membrane PSS1 Protein Enhances Disease Resistance in Transgenic Soybean Plants

Bing Wang et al. Plant Physiol. 2018 Jan.

Abstract

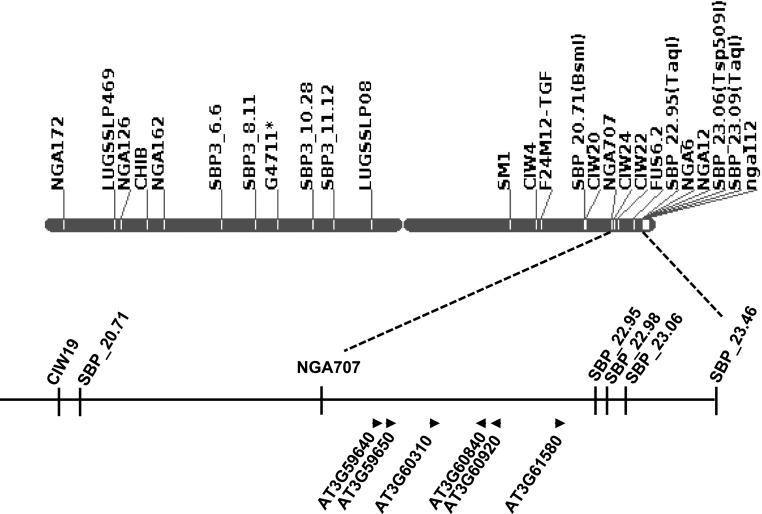
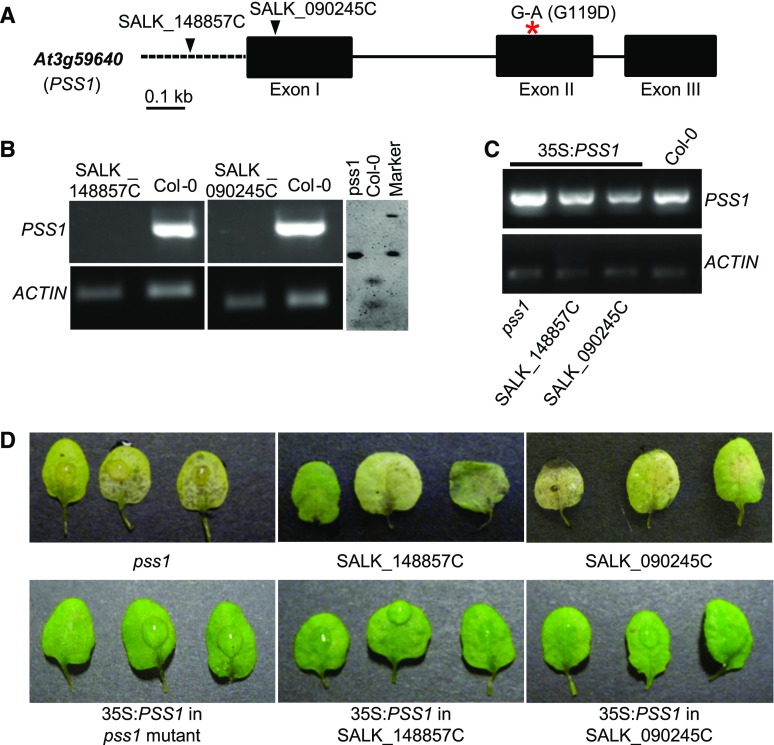
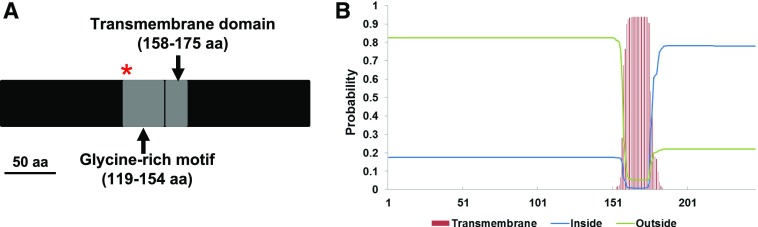
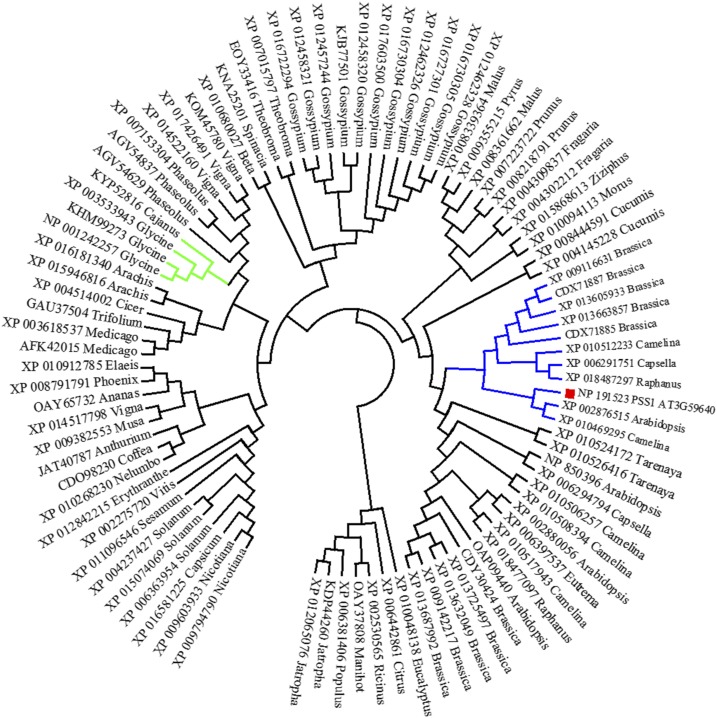
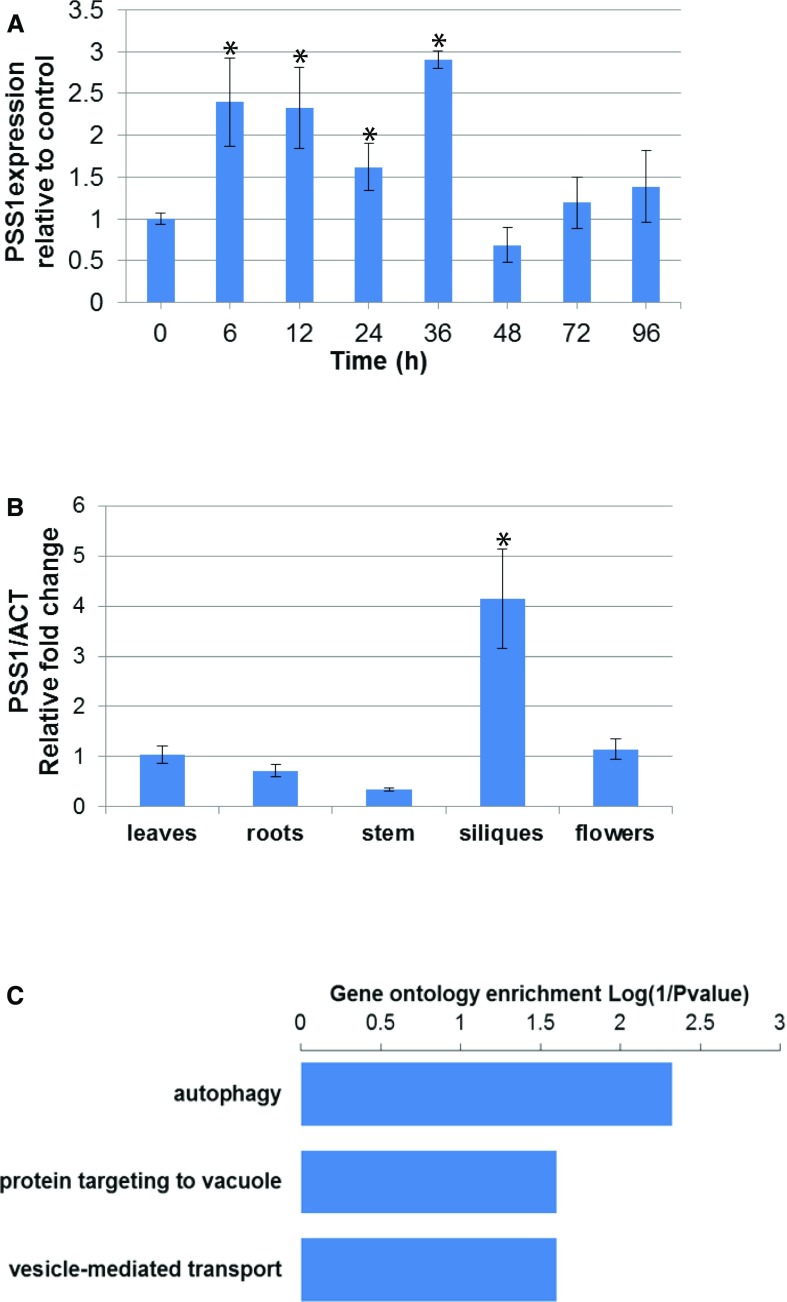
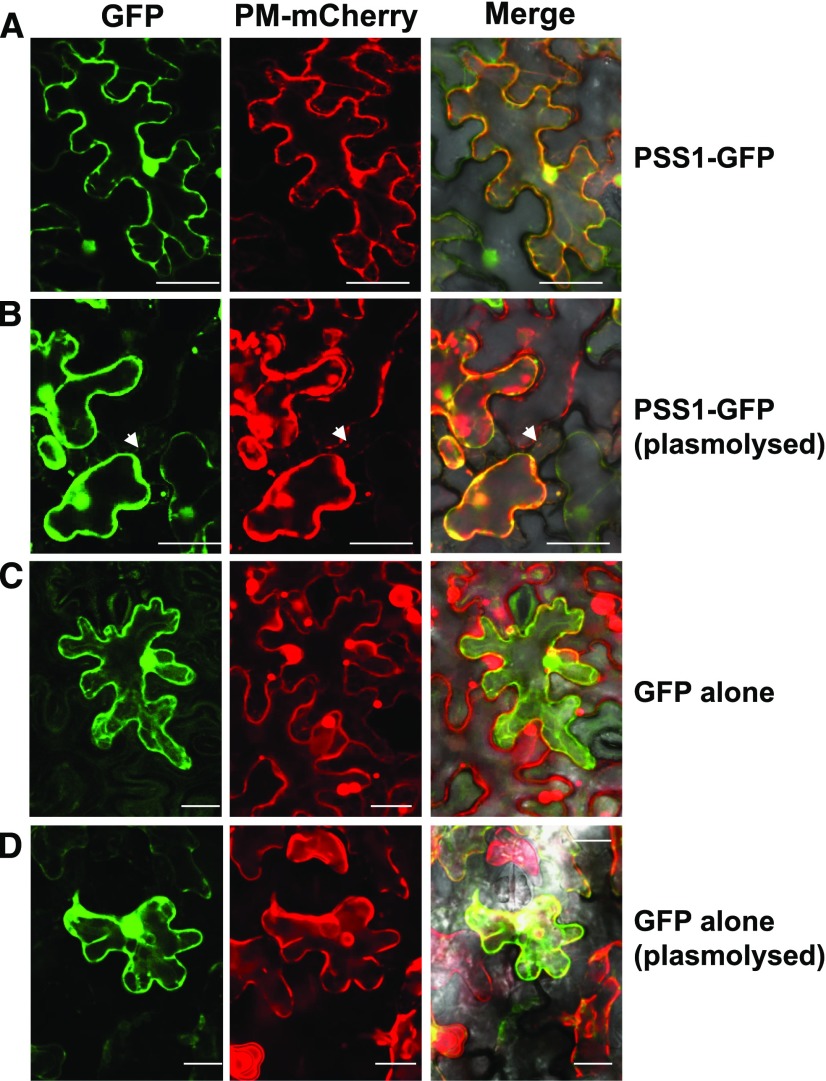
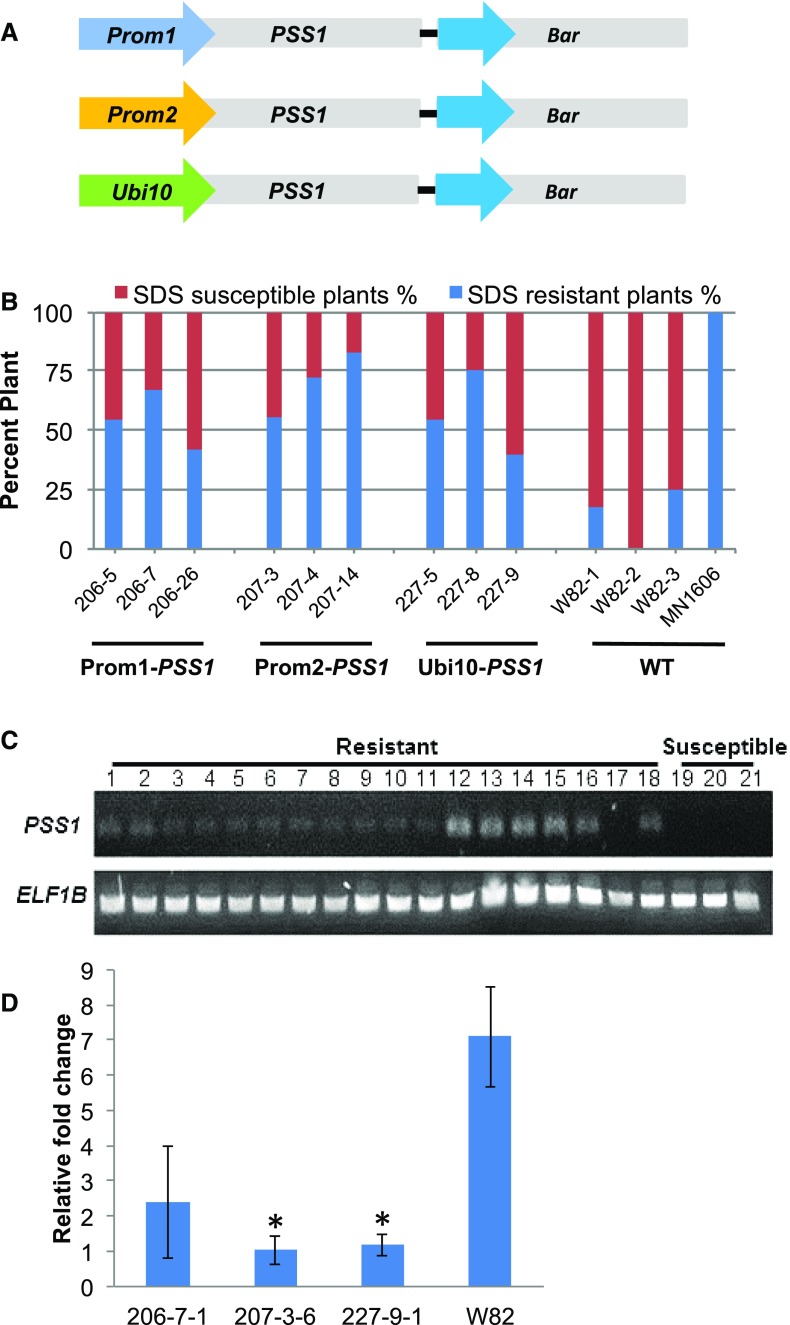
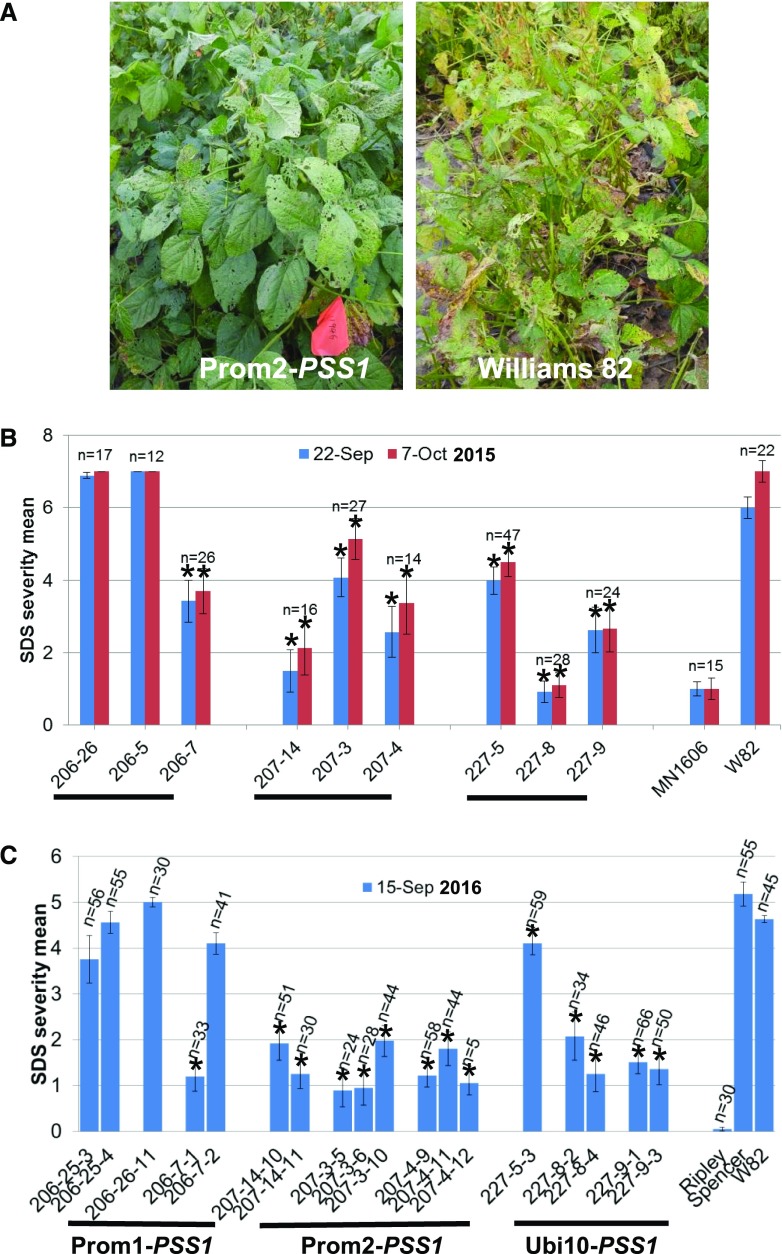
Nonhost resistance is defined as the immunity of a plant species to all nonadapted pathogen species. Arabidopsis (Arabidopsis thaliana) ecotype Columbia-0 is nonhost to the oomycete plant pathogen Phytophthora sojae and the fungal plant pathogen Fusarium virguliforme that are pathogenic to soybean (Glycine max). Previously, we reported generating the pss1 mutation in the pen1-1 genetic background as well as genetic mapping and characterization of the Arabidopsis nonhost resistance Phytophthora sojae-susceptible gene locus, PSS1 In this study, we identified six candidate PSS1 genes by comparing single-nucleotide polymorphisms of (1) the bulked DNA sample of seven F2:3 families homozygous for the pss1 allele and (2) the pen1-1 mutant with Columbia-0. Analyses of T-DNA insertion mutants for each of these candidate PSS1 genes identified the At3g59640 gene encoding a glycine-rich protein as the putative PSS1 gene. Later, complementation analysis confirmed the identity of At3g59640 as the PSS1 gene. PSS1 is induced following P. sojae infection as well as expressed in an organ-specific manner. Coexpression analysis of the available transcriptomic data followed by reverse transcriptase-polymerase chain reaction suggested that PSS1 is coregulated with ATG8a (At4g21980), a core gene in autophagy. PSS1 contains a predicted single membrane-spanning domain. Subcellular localization study indicated that it is an integral plasma membrane protein. Sequence analysis suggested that soybean is unlikely to contain a PSS1-like defense function. Following the introduction of PSS1 into the soybean cultivar Williams 82, the transgenic plants exhibited enhanced resistance to F. virguliforme, the pathogen that causes sudden death syndrome.


Figures

Figure 1.
Figure 1.
Candidate nonhost resistance PSS1 genes. The six putative nonhost-resistant genes are shown in a 1.2-Mb genomic region flanked by NGA707 and SBP_22.95 markers mapped to chromosome 3. The arrowheads indicate the orientations of six candidate PSS1 genes on the Arabidopsis Col-0 genome sequence.
Figure 2.
Figure 2.
Identification of PSS1 through mutant and complementation analyses. A, Analyses of T-DNA mutants in the At3g59640 gene. The locations of the T-DNA insertions in the At3g59640 gene between the two P. sojae-susceptible T-DNA mutants, SALK_090245C and 148857C, are shown by arrowheads. The red asterisk shows the nonsynonymous transition G-to-A mutation in exon II, which results in the substitution of Gly (G) to Asp (D) at position 119 in the pss1 mutant protein. Black boxes represent three exons, and the lines connecting exons represent introns. The promoter is shown with a dashed line. B, Molecular analyses of pss1 mutants. RT-PCR confirms the absence of PSS1 transcripts in two T-DNA mutants shown at left. The EMS-induced pss1 mutant is confirmed by AciI enzyme digestion of the PCR products of genomic DNA from pss1 and Col-0. Note that the transition mutation led to loss of the restriction site in the pss1 mutant. C, Molecular analyses of the PSS1 cDNA-transformed pss1 mutants. Electrophoresis is shown for PCR-amplified PSS1 gene sequences from the EMS-induced pss1 mutant and the SALK_148857C and SALK_090245C T-DNA mutants transformed with the 35S:PSS1 cDNA gene. D, PSS1 complemented the pss1 mutants. Phenotypes of the pss1 and two T-DNA insertion mutants in the At3g59640 gene and their respective complemented transgenic plants 3 d following P. sojae infection are shown.
Figure 3.
Figure 3.
PSS1 encodes a GRP containing a putative Gly-rich motif and a transmembrane domain. A, Schematic diagram of the PSS1 protein. The red asterisk indicates the substitution of Gly-119 with the Asp residue in pss1 mutant, and two gray boxes represent a Gly-rich motif (amino acid residues [aa] 119–154) and a transmembrane domain (amino acid residues 158–175). B, Predicted transmembrane helix between amino acid residues 158 and 175 of PSS1 (greater than 90% certainty).
Figure 4.
Figure 4.
Phylogenetic tree of the PSS1 homologs. Ninety-three PSS1 homologs were used to construct the phylogenetic tree. PSS1 is denoted with the red rectangle. The subclade containing PSS1 is shown in blue, whereas the subclade with soybean PSS1 homologs is presented in green. The percentage identity between PSS1 and soybean homologs is 38% or less.
Figure 5.
Figure 5.
Expression of PSS1 and genes that show expression patterns similar to PSS1. A, Expression of PSS1 following P. sojae infection. qRT-PCR of PSS1 was conducted following inoculation of Arabidopsis leaves with P. sojae in three independent experiments. The fold change values are relative to the mock control. PSS1 expression levels with asterisks were significantly induced (P < 0.05) when compared with the 0-h control. B, Expression patterns of PSS1 among various Arabidopsis tissues. qRT-PCR expression data of PSS1 were collected among Arabidopsis organs in three independent experiments. Expression comparison was against the levels in leaves (P < 0.05). Data in A and B are from three biological replications, and data were standardized against the transcript levels of the Actin gene. C, Gene Ontology enrichment (biological process) of PSS1 coexpression genes. The coexpression gene analysis was based on the mRNAseq data set using the software Genevestigator (Hruz et al., 2008).
Figure 6.
Figure 6.
PSS1 is localized to the plasma membrane. A, PSS1-GFP fusion and mCherry-tagged plasma membrane (PM) marker Arabidopsis PIP2A colocalized to plasma membrane of the epidermal cells of N. benthamiana. B, The colocalized PSS1-GFP and PIP2A-mCherry fluorescent proteins remain as a complex following plasmolysis with 1 m NaCl. C, Control GFP fluorescent protein was localized to cytoplasm. D, Plasmolysis of the cell coexpressing the GFP and PIP2A-mCherry proteins. White arrowheads indicate Hechtian strands (for details, see Supplemental Fig. S5). Bars = 50 μm for PSS1-GFP and 25 μm for GFP alone.
Figure 7.
Figure 7.
Expression of PSS1 enhances SDS resistance in transgenic soybean plants under growth chamber conditions. A, Schematic depiction of promoter-PSS1 fusion genes along with the CaMV 35S promoter-fused bar gene in three binary plasmids used to generate transgenic soybean plants. B, Responses of the transgenic lines to root infection with F. virguliforme Mont-1 in growth chambers. Plants with foliar SDS scores of 2 or less were considered resistant, and those with scores greater than 2 were considered susceptible. Percentage resistant and susceptible R1 progeny are presented for each of the PSS1 transgenes generated by fusing the PSS1 gene to Prom1, Prom2, and Ubi10 promoters. For each transgenic event, 15 R1 plants were studied. The experiment was repeated two more times and showed similar results. Foliar SDS symptoms for individual plants were scored 4 weeks following planting. MN1606, SDS-resistant control; WT, transgene recipient nontransgenic cv Williams 82 (W82) as the SDS-susceptible control. C, RT-PCR analysis of the transgenic R1 plants for PSS1 transcripts. Lanes 1 to 6, RT-PCR products from F. virguliforme-infected roots of three independent lines carrying promoter Prom1 fused to PSS1; lanes 7 to 12, RT-PCR products from F. virguliforme-infected roots of three independent lines carrying promoter Prom2 fused to PSS1; and lanes 13 to18, RT-PCR products from F. virguliforme-infected roots of three independent lines carrying promoter Ubi10 fused to PSS1. For each independent transgenic line, two R1 SDS-resistant plants (lanes 1–18) were analyzed. Lanes 19 to 21, RT-PCR products from F. virguliforme-infected roots of three independent R1 progeny plants that were SDS susceptible. D, Relative biomasses of F. virguliforme measured by genomic DNA qPCR of the FvTox1 gene among three independent transgenic lines. Root samples were collected 2 weeks following infection with the F. virguliforme Mont-1 isolate in a growth chamber. 206-7-1, Transgenic line carrying Prom1-PSS1; 207-3-6, transgenic line carrying Prom21-PSS1; 227-9-1, transgenic line carrying the Ubi10-1-PSS1 fusion gene; W82, cv Williams 82. Asterisks indicate statistical significance at P < 0.05 when compared with the biomass of F. virguliforme in cv Williams 82.
Figure 8.
Figure 8.
Expression of PSS1 enhances SDS resistance in transgenic soybean plants under field conditions. A, Representative field plot showing SDS-resistant transgenic and cv Williams 82 control plants. B and C, Mean foliar SDS severity for individual transgenic lines in the 2015 and 2016 field trials. Each line comprised 12 to 66 Basta-resistant R1 or R2 seedlings. The experiment was conducted in a randomized block design. Asterisks indicate significant reductions in foliar SDS scores between transgenic lines and the nontransgenic recipient cv Williams 82 (W82) control at P < 0.05.

Similar articles

Cited by

References

    1. Ahn IP. (2008) Glufosinate ammonium-induced pathogen inhibition and defense responses culminate in disease protection in bar-transgenic rice. Plant Physiol 146: 213–227 - PMC - PubMed
    1. Alonso JM, Stepanova AN, Leisse TJ, Kim CJ, Chen H, Shinn P, Stevenson DK, Zimmerman J, Barajas P, Cheuk R, et al. (2003) Genome-wide insertional mutagenesis of Arabidopsis thaliana. Science 301: 653–657 - PubMed
    1. Ballouz S, Verleyen W, Gillis J (2015) Guidance for RNA-seq co-expression network construction and analysis: safety in numbers. Bioinformatics 31: 2123–2130 - PubMed
    1. Bradley C, Allen T (2014) Estimates of soybean yield reductions caused by diseases in the United States. http://extension.cropsciences.illinois.edu/fieldcrops/diseases/ yield_re... (November 1, 2017)
    1. Brar HK, Bhattacharyya MK (2012) Expression of a single-chain variable-fragment antibody against a Fusarium virguliforme toxin peptide enhances tolerance to sudden death syndrome in transgenic soybean plants. Mol Plant Microbe Interact 25: 817–824 - PubMed

Publication types

MeSH terms

LinkOut - more resources