. 2017 Nov 3;7(1):14981.
doi: 10.1038/s41598-017-14092-7.

Translational utility of a hierarchical classification strategy in biomolecular data analytics

Affiliations

Translational utility of a hierarchical classification strategy in biomolecular data analytics

Dieter Galea et al. Sci Rep. .

Abstract

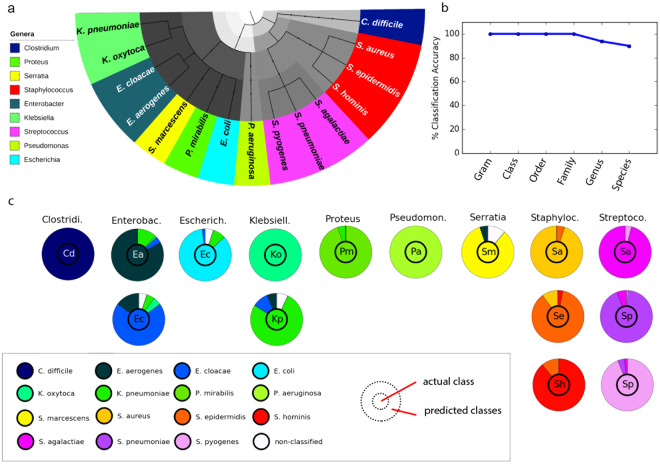
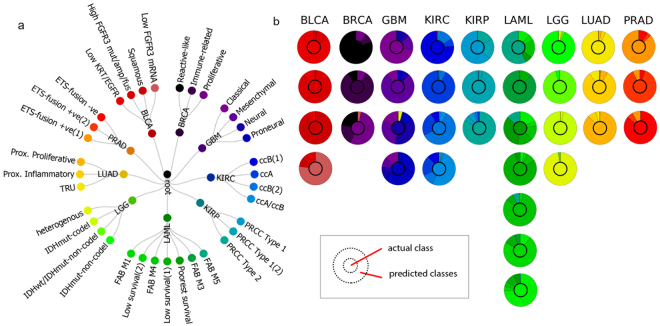
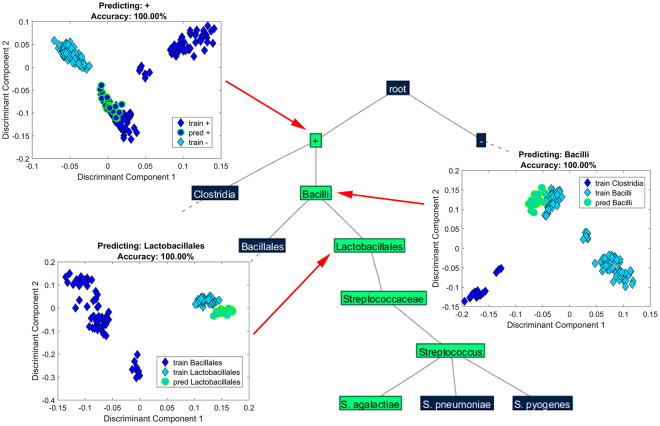
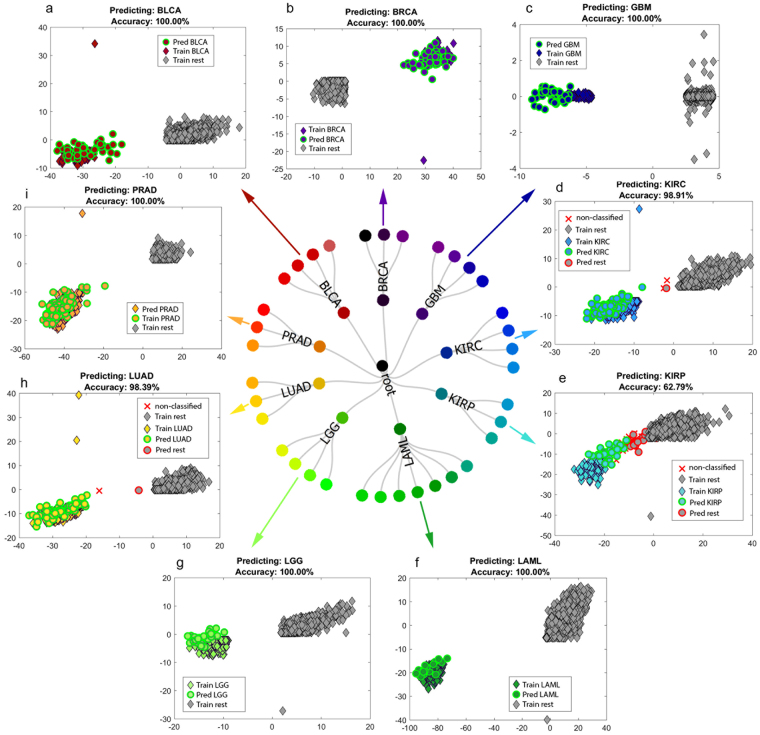
Hierarchical classification (HC) stratifies and classifies data from broad classes into more specific classes. Unlike commonly used data classification strategies, this enables the probabilistic prediction of unknown classes at different levels, minimizing the burden of incomplete databases. Despite these advantages, its translational application in biomedical sciences has been limited. We describe and demonstrate the implementation of a HC approach for "omics-driven" classification of 15 bacterial species at various taxonomic levels achieving 90-100% accuracy, and 9 cancer types into morphological types and 35 subtypes with 99% and 76% accuracy, respectively. Unknown bacterial species were probabilistically assigned with 100% accuracy to their respective genus or family using mass spectra (n = 284). Cancer types were predicted by mRNA data (n = 1960) for most subtypes with 95-100% accuracy. This has high relevance in clinical practice where complete datasets are difficult to compile with the continuous evolution of diseases and emergence of new strains, yet prediction of unknown classes, such as bacterial species, at upper hierarchy levels may be sufficient to initiate antimicrobial therapy. The algorithms presented here can be directly translated into clinical-use with any quantitative data, and have broad application potential, from unlabeled sample identification, to hierarchical feature selection, and discovery of new taxonomic variants.


Conflict of interest statement

The authors declare that they have no competing interests.

Figures

Figure 1
Figure 1
Hierarchical classification of bacterial mass spectral profiles. (a) Hierarchical tree structure for the bacterial species analyzed, where color-coding represents species belonging to the same genus, as indicated in the legend. Grey-scaling indicates upper level hierarchies; (b) Plot of the mean % classification accuracies for 5 predictions at the different tree levels achieved by the selective classifier approach; (c) Semi-quantitative plot showing the classification performance at the lower-most/species level, as well as where misclassifications occurred. The inner circle indicates the actual species while the outer circle indicates the predicted class. Each column represents a genus while rows represent one or multiple species belonging to the respective genus. The overall color for the species in each genus corresponds to the color legend in (a).
Figure 2
Figure 2
Cancer genomic dataset hierarchical classification. (a) Hierarchical tree structure for the cancer dataset analyzed derived from previous literature, where cancer types (level 1) were classified with a mean accuracy of 99% while subtypes (level 2) were classified with a mean accuracy of 76 ± 2%; (a) Semi-quantitative plot showing the classification performance at the bottom-most level/cancer sub-type level, as well as where misclassifications occurred. The inner circle indicates the actual class while outer circle indicates the predicted class. Columns represent the different cancer types while rows represent corresponding sub-types. Sub-type colors correspond with the node colors assigned in the lower-most layer of the hierarchical tree (a).
Figure 3
Figure 3
Representative leave-one-species-out scores plots for the prediction of unknown bacterial spectra. Part of the bacterial classification tree with representative discrimination plots generated for the prediction of Streptococcus agalactiae at various hierarchical levels using the leave-one-species-out algorithm, where S. agalactiae was omitted and predicted. Correctly predicted samples are indicated by a green outline. S. agalactiae was predicted up to genus level with 100% accuracy. The scores plotted are obtained from the ‘best’-chosen dimensionality reduction space.
Figure 4
Figure 4
Representative leave-one-subtype-out scores plots. Discrimination plots generated for the prediction of: (a) ‘squamous’ subtype to bladder urothelial carcinoma (BLCA); (b) ‘reactive-like’ subtype to breast adenocarcinoma (BRCA); (c) ‘classical’ subtype to glioblastoma multiforme (GBM); (d) ‘ccB(2)’ subtype to kidney renal clear cell carcinoma (KIRC); (e) ‘PRCC Type 2’ subtype to kidney renal papillary cell carcinoma (KIRP); (f) ‘FAB M5’ subtype to acute myeloid leukemia (LAML); (g) ‘IDHmut-codel’ to lower grade glioma (LGG); (h) ‘proximal proliferative’ to lung adenocarcinoma (LUAD); and (i) ‘ETS-fusion negative’ to prostate adenocarcinoma (PRAD). Correctly predicted samples are indicated by green outline, a red ‘x’ denotes non-classified samples and misclassified samples are indicated by red outline. Axes represent discriminant components, where the second component is used only for visualization purposes. The scores plotted are obtained from the ‘best’-chosen dimensionality reduction space. Subtype assignment information is provided in the Methods and Supplementary Information Note 1. Most subtypes were correctly assigned to the respective cancer type with 95–100% accuracy (see Supplementary Table 4).

References

    1. Mirnezami R, Nicholson J, Darzi A. Preparing for Precision Medicine. N. Engl. J. Med. 2012;366:489–491. doi: 10.1056/NEJMp1114866. - DOI - PubMed
    1. Silla CNJ, Freitas AA. A survey of hierarchical classification across different application domains. Data Min. and Knowl. Discov. 2010;22:31–72. doi: 10.1007/s10618-010-0175-9. - DOI
    1. Li J, Fong S, Zhuang Y, Khoury R. Hierarchical classification in text mining for sentiment analysis of online news. IJSCAI. 2016;20:3411–3420.
    1. Cesa-Bianchi N, Gentile C, Zaniboni L. Incremental Algorithms for Hierarchical Classification. J. Mach. Learn. Res. 2006;7:31–54.
    1. Barutcuoglu Z, Schapire RE, Troyanskaya OG. Hierarchical multi-label prediction of gene function. Bioinformatics. 2006;22:830–836. doi: 10.1093/bioinformatics/btk048. - DOI - PubMed

Publication types