. 2017 Nov 3;7(1):14993.
doi: 10.1038/s41598-017-12890-7.

In human non-REM sleep, more slow-wave activity leads to less blood flow in the prefrontal cortex

Affiliations

In human non-REM sleep, more slow-wave activity leads to less blood flow in the prefrontal cortex

Laura Tüshaus et al. Sci Rep. .

Abstract

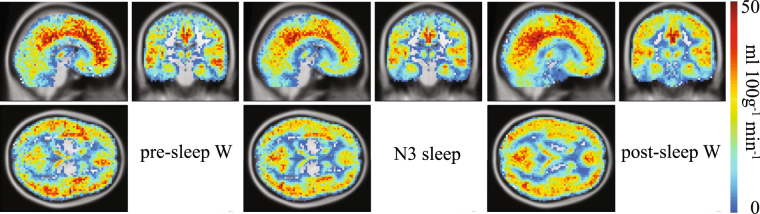
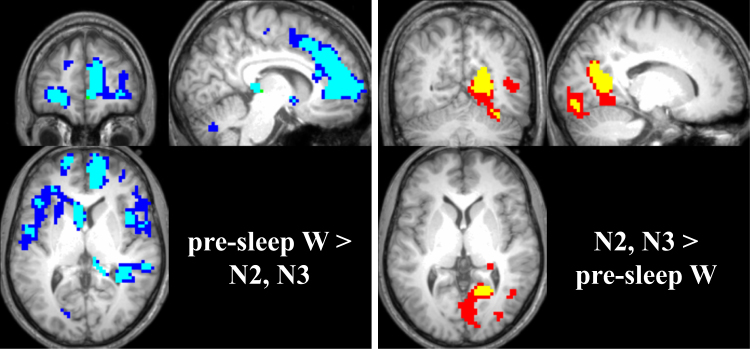
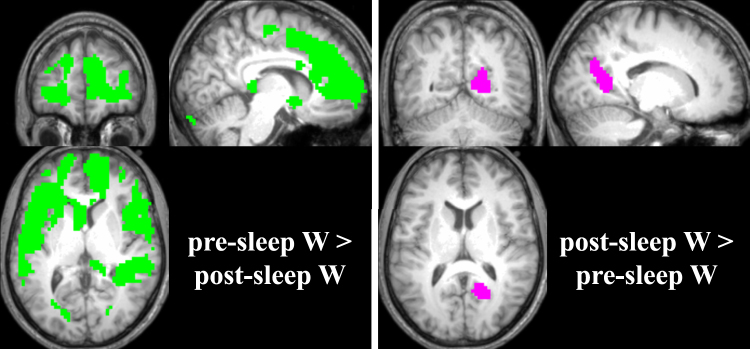
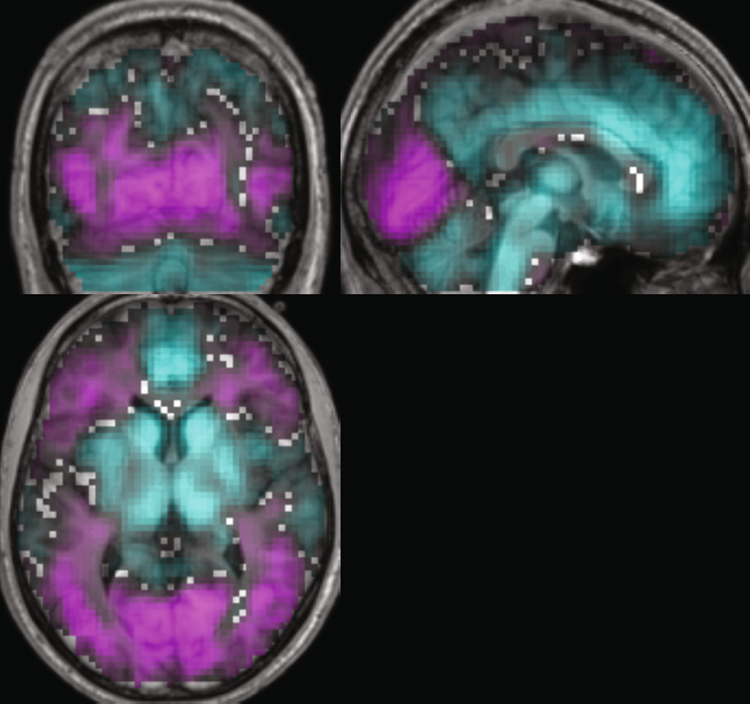
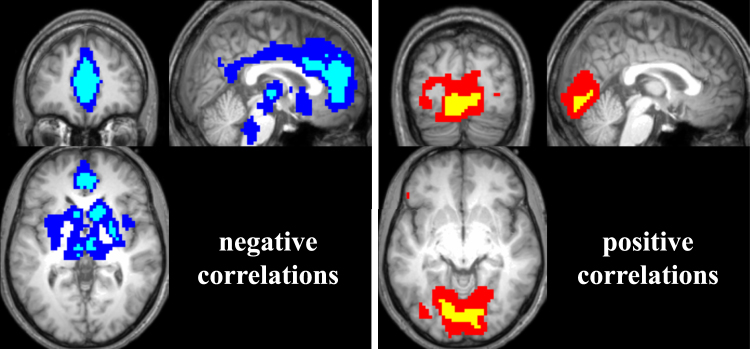
Cerebral blood flow (CBF) is related to integrated neuronal activity of the brain whereas EEG provides a more direct measurement of transient neuronal activity. Therefore, we addressed what happens in the brain during sleep, combining CBF and EEG recordings. The dynamic relationship of CBF with slow-wave activity (SWA; EEG sleep intensity marker) corroborated vigilance state specific (i.e., wake, non-rapid eye movement (NREM) sleep stages N1-N3, wake after sleep) differences of CBF e.g. in the posterior cingulate, basal ganglia, and thalamus, indicating their role in sleep-wake regulation and/or sleep processes. These newly observed dynamic correlations of CBF with SWA - namely a temporal relationship during continuous NREM sleep in individuals - additionally implicate an impact of sleep intensity on the brain's metabolism. Furthermore, we propose that some of the aforementioned brain areas that also have been shown to be affected in disorders of consciousness might therefore contribute to the emergence of consciousness.


Conflict of interest statement

The authors declare that they have no competing interests.

Figures

Figure 1
Figure 1
Mean cerebral blood flow (CBF) across vigilance stages. Left panel: Mean CBF across pre-sleep wake epochs (n = 16). Middle panel: Mean CBF across NREM sleep stage N3 sleep (n = 19). Right panel: Mean CBF across post-sleep wake epochs (n = 14). The absolute CBF values increase from cold to warm colors. Slices were positioned at MNI coordinates x: 6, y: −22, z: 4. Only subjects who contributed with at least 7 scans in the respective vigilance stage, i.e. ≈1 min, were included (see Table S2 for more details).
Figure 2
Figure 2
CBF during NREM sleep compared to wake. Left panel: Blue areas denote brain areas displaying lower CBF in N2 compared to pre-sleep wake; cyan areas lower CBF in N3 compared to pre-sleep wake. Slices were positioned at MNI coordinates x: 8, y: 48, z: 6. Right panel: Red areas depict areas of higher CBF during N3 compared to pre-sleep wake; yellow areas higher CBF during N2 compared to pre-sleep wake. Slices were positioned at MNI coordinates x: 16, y: −60, z: 2. All changes are displayed as p < 0.05 family-wise error (FWE) corrected with a cluster extent of 20 voxels.
Figure 3
Figure 3
CBF differences between pre-sleep wake and post-sleep wake. Left panel: Green areas denote brain areas displaying lower CBF values during post-sleep wake compared to pre-sleep wake. Slices were positioned at MNI coordinates x: 8, y: 48, z: 6. Right panel: Pink areas depict areas of higher CBF during post-sleep wake compared to pre-sleep wake. Slices were positioned at MNI coordinates x: 16, y: −58, z: 11. All changes are displayed as p < 0.05 family-wise error (FWE) corrected with a cluster extent of 20 voxels.
Figure 4
Figure 4
Spatial distribution of mean correlations of CBF and SWA across participants. Mean positive (pink) and negative (cyan) correlations of CBF with SWA (n = 19). Depicted are correlation coefficients ranging from 0.01 to 0.5 and −0.01 to −0.5, respectively. Slices were positioned at MNI coordinates x: 2, y: −71, z: 4.
Figure 5
Figure 5
Significant correlations of CBF with SWA. Left panel: Depicted are areas where CBF was negatively correlated with SWA (blue: p < 0.01 uncorrected, cyan: p < 0.05 FWE corrected, cluster extent of 20 voxels). Slices were positioned at MNI coordinates x: 2, y: 45, z: 0. Right panel: Depicted are areas where CBF was positively correlated with SWA (red: p < 0.01 uncorrected, yellow: p < 0.05 FWE corrected, cluster extent of 20 voxels). Slices were positioned at MNI coordinates x: 2, y: −82, z: −8. 19 subjects contributed to this analysis.

References

    1. Berticat, C. et al. Excessive daytime sleepiness and antipathogen drug consumption in the elderly: a test of the immune theory of sleep. Scientific Reports6 (2016). - PMC - PubMed
    1. Bryant PA, Trinder J, Curtis N. Sick and tired: Does sleep have a vital role in the immune system? Nat Rev Immunol. 2004;4:457–467. doi: 10.1038/nri1369. - DOI - PubMed
    1. Ibarra-Coronado, E. G. et al. The Bidirectional Relationship between Sleep and Immunity against Infections. Journal of Immunology Research2015 (2015). - PMC - PubMed
    1. Roffwarg HP, Muzio JN, Dement WC. Ontogenetic development of the human sleep-dream cycle. Science. 1966;152:604–619. doi: 10.1126/science.152.3722.604. - DOI - PubMed
    1. Lesku JA, Roth TC, 2nd, Amlaner CJ, Lima SL. A phylogenetic analysis of sleep architecture in mammals: the integration of anatomy, physiology, and ecology. Am Nat. 2006;168:441–453. doi: 10.1086/506973. - DOI - PubMed

Publication types