. 2017 Nov 3;8(1):1307.
doi: 10.1038/s41467-017-01503-6.

Cell-permeable organic fluorescent probes for live-cell long-term super-resolution imaging reveal lysosome-mitochondrion interactions

Affiliations

Cell-permeable organic fluorescent probes for live-cell long-term super-resolution imaging reveal lysosome-mitochondrion interactions

Yubing Han et al. Nat Commun. .

Abstract

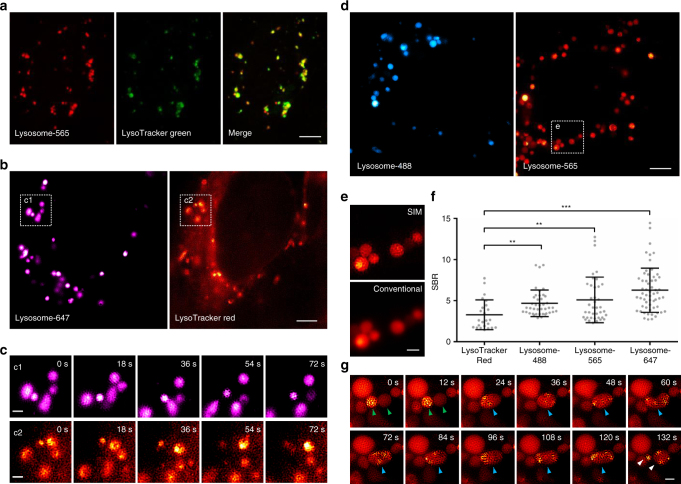
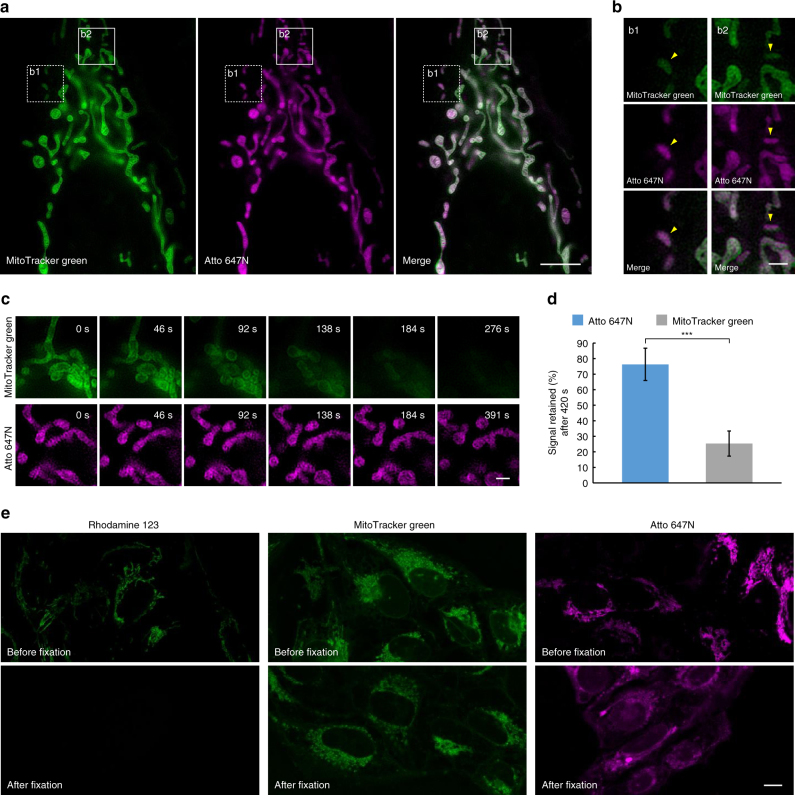
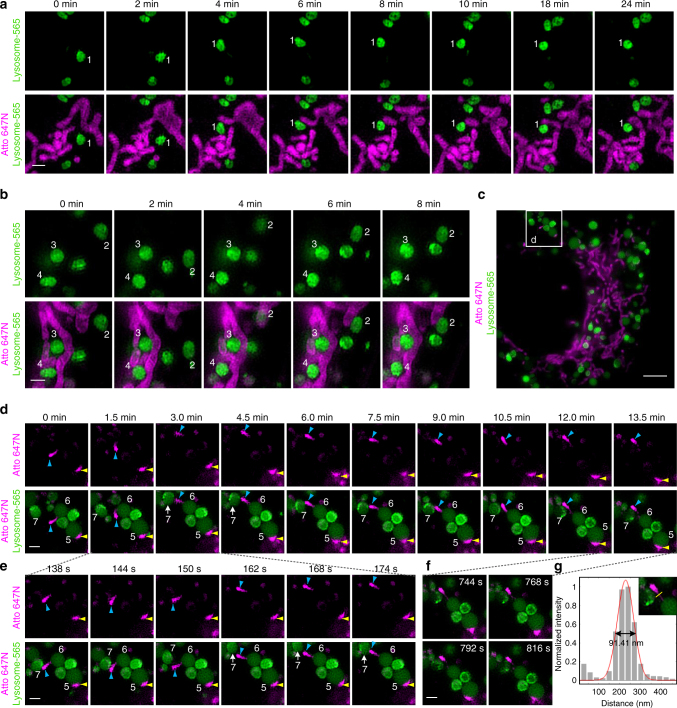
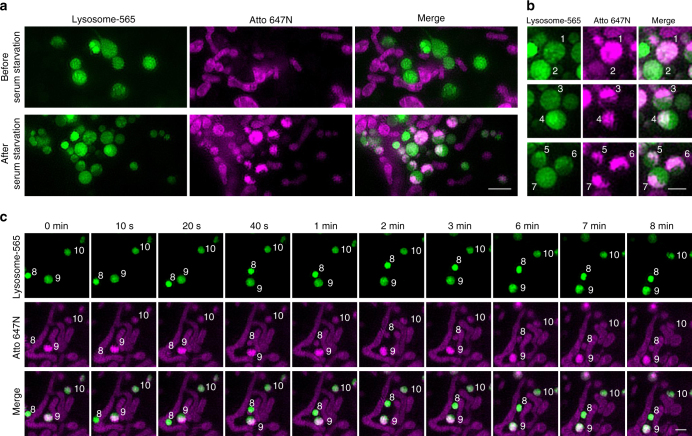
Characterizing the long-term nanometer-scale interactions between lysosomes and mitochondria in live cells is essential for understanding their functions but remains challenging due to limitations of the existing fluorescent probes. Here, we develop cell-permeable organic fluorescent probes for lysosomes with excellent specificity and high photostability. We also use an existing Atto 647N dye with high brightness and excellent photostability to achieve specific labeling of mitochondria in live cells. Using these probes, we obtain dual-color structured illumination microscopy (SIM) images of dynamic physical lysosome-mitochondrion interactions in live cells at an ~90-nm resolution over a long time course of ~13 min. We successfully record the consecutive dynamic processes of lysosomal fusion and fission, as well as four types of physical lysosome-mitochondrion interactions by super-resolution imaging. Our probes provide an avenue for understanding the functions and the dynamic interplay of lysosomes and mitochondria in live cells.


Conflict of interest statement

The authors declare no competing financial interests.

Figures

Fig. 1
Fig. 1
Characterization of the lysosomal probes in live cells. a A co-localization study employing LysoTracker Green as the standard lysosomal marker. Live U2OS cells were simultaneously stained with Lysosome-565 (red) and LysoTracker Green (green, 50 nM) for 30 min and imaged by confocal microscopy. b Dual-color SIM images of lysosomes in live U2OS cells stained with both Lysosome-647 (magenta) and LysoTracker Red (red, 50 nM). c Enlarged time-lapse images from the boxed regions shown in b. d SIM images of live U2OS cells after incubation with Lysosome-488 (blue) or Lysosome-565 (red). e Enlarged super-resolution SIM (upper panel) and diffraction-limited (lower panel) images from the boxed region shown in d. f Average signal (lysosomes) to background (cytosol) ratios (SBR) of LysoTracker Red (SBR from n = 24 areas), Lysosome-488 (SBR from n = 41 areas), Lysosome-565 (SBR from n = 40 areas), and Lysosome-647 (SBR from n = 58 areas) in three SIM images (mean ± s.d.; ** P < 0.01, *** P < 0.0001, two-tailed t-test; statistics were performed using SPSS 19.0 software package (IBM Co.)). g Time-lapse images illustrating the process of lysosomal fission-fusion. Each SIM frame was acquired over 270 ms (i.e., a raw data exposure time of 30 ms). For the time-lapse images, consecutive SIM frames spaced at 6-s intervals were obtained; representative images of consecutive SIM frames are displayed (more frames are shown in Supplementary Movie 1). Scale bars, a 5 μm, b, d 4 μm, and c, e, g 1 μm
Fig. 2
Fig. 2
Characterization of Atto 647N in live cells. a A co-localization study employing MitoTracker Green as the standard mitochondrial marker. Live U2OS cells were simultaneously stained with MitoTracker Green (green, 400 nM) and Atto 647N (magenta, 15 µM) for 30 min and imaged by SIM. b Enlargements of the boxed regions in a. c Time-lapse SIM images of live U2OS cells stained with MitoTracker Green (green, 400 nM) or Atto 647N (magenta, 15 μM). d The percentage of retained fluorescence intensity of Atto 647N and MitoTracker Green after 420 s of time-lapse SIM imaging (from n = 10 areas, mean ± s.d.; *** P < 0.0001, two-tailed t-test; statistics were performed using SPSS 19.0 software package (IBM Co.)). e Confocal images of U2OS cells stained with Rhodamine 123 (2 µM), MitoTracker Green (400 nM), or Atto 647N (15 µM) before and after cell fixation. Each SIM frame was acquired over 270 ms (i.e., a raw data exposure time of 30 ms). For the time-lapse images, consecutive SIM frames spaced at ~ 1.15-s intervals were obtained; representative images of consecutive SIM frames are displayed. Scale bars, a 5 μm, b, c 1 μm, and e 10 μm
Fig. 3
Fig. 3
Dual-color SIM images of lysosomes and mitochondria in live cells. a, b, d, e, f Representative time-lapse SIM images reveal different types of dynamic physical interactions between lysosomes and mitochondria in live U2OS cells stained with Lysosome-565 (green) and Atto 647N (magenta) (more frames are shown in Supplementary Movies 3–5). c A SIM image of a whole live U2OS cell. g Cross-sectional profile of the tubular structure of the mitochondrion in f at a full-width at the half-maximum (FWHM) of 91 nm. Each SIM frame was acquired over 270 ms (i.e., a raw data exposure time of 30 ms). For the time-lapse images, the time interval between each dual-color SIM image was set to 6 s. Scale bars, a, b, d, e, f 1 μm, and c 4 μm
Fig. 4
Fig. 4
Determination of co-localization of mitochondria with lysosomes during mitophagy. a Dual-color SIM images of lysosomes (green) and mitochondria (magenta) before and after serum starvation in live U2OS cells. Live U2OS cells stained with Lysosome-565 (green) and Atto 647N (magenta) were incubated with culture medium without fetal bovine serum (FBS) for 4 h before imaging. b Representative mitochondria within lysosomes with diverse shapes. c Time-lapse SIM images reveal dynamics of the autolysosomes after serum starvation (more frames are shown in Supplementary Movie 6). Each SIM frame was acquired over 270 ms (i.e., a raw data exposure time of 30 ms). For the time-lapse images, the time interval between each dual-color SIM image was set to 10 s; representative images of consecutive SIM frames are displayed. Scale bars, a 2 μm, and b, c 1 μm

References

    1. Schrader M, Godinho LF, Costello JL, Islinger M. The different facets of organelle interplay–an overview of organelle interactions. Front. Cell Dev. Biol. 2015;3:1–22. doi: 10.3389/fcell.2015.00056. - DOI - PMC - PubMed
    1. Murley A, Nunnari J. The emerging network of mitochondria-organelle contacts. Mol. Cell. 2016;61:648–653. doi: 10.1016/j.molcel.2016.01.031. - DOI - PMC - PubMed
    1. Mizushima N, Levine B, Cuervo AM, Klionsky DJ. Autophagy fights disease through cellular self-digestion. Nature. 2008;451:1069–1075. doi: 10.1038/nature06639. - DOI - PMC - PubMed
    1. Choi AMK, Ryter SW, Levine B. Autophagy in human health and disease. N. Engl. J. Med. 2013;368:651–662. doi: 10.1056/NEJMra1205406. - DOI - PubMed
    1. Elbaz-Alon Y, et al. A dynamic interface between vacuoles and mitochondria in yeast. Dev. Cell. 2014;30:95–102. doi: 10.1016/j.devcel.2014.06.007. - DOI - PubMed

Publication types

Substances