. 2017 Nov 3;8(1):1282.
doi: 10.1038/s41467-017-01476-6.

Plasmodium DNA-mediated TLR9 activation of T-bet+ B cells contributes to autoimmune anaemia during malaria

Affiliations

Plasmodium DNA-mediated TLR9 activation of T-bet+ B cells contributes to autoimmune anaemia during malaria

J Rivera-Correa et al. Nat Commun. .

Abstract

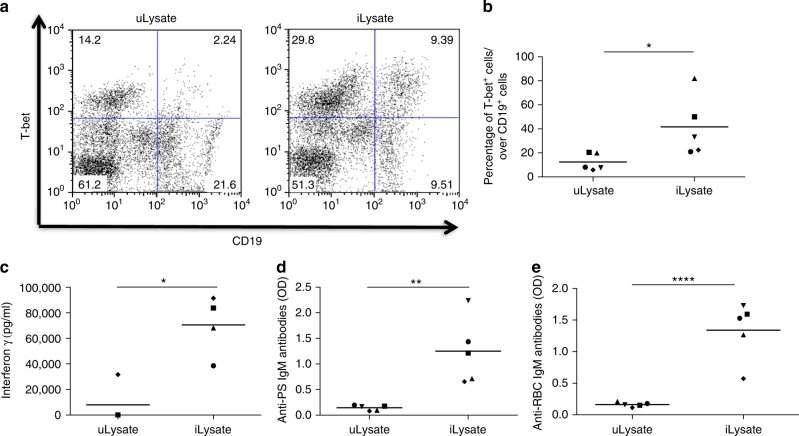
Infectious pathogens contribute to the development of autoimmune disorders, but the mechanisms connecting these processes are incompletely understood. Here we show that Plasmodium DNA induces autoreactive responses against erythrocytes by activating a population of B cells expressing CD11c and the transcription factor T-bet, which become major producers of autoantibodies that promote malarial anaemia. Additionally, we identify parasite DNA-sensing through Toll-like receptor 9 (TLR9) along with inflammatory cytokine receptor IFN-γ receptor (IFN-γR) as essential signals that synergize to promote the development and appearance of these autoreactive T-bet+ B cells. The lack of any of these signals ameliorates malarial anaemia during infection in a mouse model. We also identify both expansion of T-bet+ B cells and production of anti-erythrocyte antibodies in ex vivo cultures of naive human peripheral blood mononuclear cells (PBMC) exposed to P. falciprum infected erythrocyte lysates. We propose that synergistic TLR9/IFN-γR activation of T-bet+ B cells is a mechanism underlying infection-induced autoimmune-like responses.


Conflict of interest statement

The authors declare no competing financial interests.

Figures

Fig. 1
Fig. 1
CD11c+ T-bet+ B cells expand during Plasmodium infection and correlate with severe anaemia. Gating scheme a and representative plots b for surface marker characterization in gated CD19+ splenocytes from uninfected (black line, B220high) or P. yoelii-infected mice at day 10 post infection gated for B220high CD11c+ (red line) or for B220 lowCD138+ (blue line, conventional plasmablasts and plasma cells), with respective isotype control antibodies (gray shadow). c Representative plots and quantification of T-bet-expressing B cells within the gates described in (b). Experiments in a, b were repeated 2 times. d, f Quantification of CD11c+ B cells in spleen (gated as described in b, red line) across the days of infection, compared to parasitemia (d), anaemia development (e) and anti-PS IgG antibodies (RU relative units) (f) (black line). Each data point represents the mean ± SD of n = 3 mice. Different groups of three mice were killed and analyzed on each day of infection. Significance determined by unpaired Student’s t test *p < 0.05
Fig. 2
Fig. 2
CD11c+ T-bet+ B cells are the main producers of autoantibodies during P. yoelii infection. a B-cell ELISPOT of splenocytes from uninfected and P. yoelii-infected mice at day 10 post infection. b, c Quantification of antibody-secreting cells (gray squares) and antibodies (black circles) against PS (b) and RBC (c) antigens and across P. yoelii infection. d Representative plots of gated CD19+ splenocytes to identify CD11c+ T-bet+ B cells. e B-cell ELISPOT on enriched CD11c+ B cells and CD138+ plasma cells from P. yoelii-infected mice at day 6 post infection. Each data point represent the mean ± SD of n = 3 mice. Experiments were repeated 2 times, one representative example is shown. Significance determined by unpaired Student’s t test *p < 0.05, **p < 0.01, ***p < 0.001, ****p < 0.0001
Fig. 3
Fig. 3
IFN-γ synergizes with Plasmodium molecules to induce T-bet expression on B cells in vitro. ac Purified naive B cells (CD43) from uninfected mice were cultured under the indicated conditions for 3 days, when T-bet expression was determined in CD19+ cells. P. yoelii-infected RBC lysate (iLysate), uninfected RBC lysate (uLysate), agonist of TLR7 (R848). Representative histogram of T-bet expression (right panel, a) of the indicated conditions. Experiments were repeated 2 times, one representative example is shown. Bars represent the means ± SD of n = 3 mice. Significance determined by one-way ANOVA *p < 0.05, **p < 0.01, ***p < 0.001, ****p < 0.0001
Fig. 4
Fig. 4
Plasmodium DNA enhances IFN-γ-dependent T-bet expression through B-cell intrinsic TLR9 in vitro. Purified naive B cells (CD43) from uninfected mice were cultured under the indicated conditions for 3 days, when T-bet expression was determined in CD19+ cells from control uninfected WT mice (a, c) or from Ifngr1 −/−, Tbx21 −/− or Tlr9 −/− mice. b P. yoelii-infected RBC lysate (iLysate), uninfected RBC lysate (uLysate), antagonists of TLR7 or TLR9 (ODN 20958 TLR7i or A151 TLR9i), DNase, or RNase treated iLysates. Experiments were repeated two times, one representative example is shown. Bars represent the means ± SD of n = 3 mice (a, c) or of triplicated samples from one mouse (b). Significance determined by one-way ANOVA *p < 0.05, **p < 0.01, ****p < 0.0001
Fig. 5
Fig. 5
Deficiency in IFN-γ or T-bet confers partial protection against malarial anaemia in P. yoelii-infected mice. a, b Quantification of CD11c+ T-bet+ cells from gated CD19+ splenocytes from healthy WT naive mice (black bars), Ifngr1 −/− (a, gray bar), or Tbx21 −/− (b, gray bar). c PS B-cell ELISPOT of splenocytes from P. yoelii-infected WT, Ifngr1 −/− or Tbx21 −/− from mice at day 8 and 15 post infection. d, i Quantification of anaemia development (d, g), anti-PS IgG antibodies (e, h) and parasitemia (f, i) across the days of infection of P. yoelii-infected WT (black line), Ifngr1 −/− (d-f, gray line) or Tbx21 −/− (gi, gray line) mice. RU relative units. Bars and line graphs represent the mean ± SD of n = 3 mice. Experiments were repeated 2 times, one representative example is shown. Significance determined by unpaired Student’s t test *p < 0.05, **p < 0.01, ****p < 0.0001
Fig. 6
Fig. 6
B-cell-specific deletion of IFN-γR or T-bet leads to a reduced anti-PS B-cell response during P. yoelii infection. ac Quantification of anti-PS, anti-RBC lysate or anti-MSP-1 IgG antibodies (RU relative units) from mixed bone marrow chimeras harboring either WT (circle), Ifngr1 −/− (square), Tbx21 −/−(triangle) B cells (a, b). Significance determined by two-way ANOVA followed by F-statistic test. Graphs represent the individual values of n = 11 mice with the mean *p < 0.05, **p < 0.01, ***p < 0.001, ****p < 0.0001
Fig. 7
Fig. 7
TLR9 regulates malarial anaemia and autoimmune responses in P. yoelii-infected mice. ad Quantification of CD11c+ T-bet+ B cells (a), anaemia development (b), anti-PS IgG antibodies (RU relative units) (c), and parasitemia (d) of P. yoelii-infected WT (black line or bar) or Tlr9 −/− (gray line or bar) mice at different days after infection. e PS B-cell ELISPOT of splenocytes from P. yoelii-infected WT (black bars) or from Tlr9 −/− (gray bars) mice at days 8 and 15 post infection. Experiments were repeated 2 times, one representative example is shown. Bars and line graphs represent the means ± SD of n = 3 mice (ad) or n = 2 (e). Significance determined by unpaired Student’s t test *p < 0.05
Fig. 8
Fig. 8
P. falciparum drives expansion of human T-bet+ B cells and production of anti-PS and anti-RBC antibodies in vitro. Representative plots a and quantification b of CD19+ T-bet+ cells from human naive PBMCs cultured for 6 days with uninfected RBC lysates (uLysate) or P. falciparum-infected RBC lysates (iLysate). Detection of IFN-γ (c), anti-PS IgM (d), and anti-RBC IgM (e) antibodies in the supernatants of PBMCs cultured for 11 days. Each symbol represents a result from one individual donor and experiment. Significance determined by matched one-way ANOVA. Graphs represent the grand means of n = 5 donors *p < 0.05, **p < 0.01, ****p < 0.0001

References

    1. Berlin T, et al. Autoantibodies in nonautoimmune individuals during infections. Ann. N. Y. Acad. Sci. 2007;1108:584–593. doi: 10.1196/annals.1422.061. - DOI - PubMed
    1. Kivity S, Agmon-Levin N, Blank M, Shoenfeld Y. Infections and autoimmunity--friends or foes? Trends Immunol. 2009;30:409–414. doi: 10.1016/j.it.2009.05.005. - DOI - PubMed
    1. Daniel-Ribeiro CT, Zanini G. Autoimmunity and malaria: what are they doing together? Acta Trop. 2000;76:205–221. doi: 10.1016/S0001-706X(00)00099-1. - DOI - PubMed
    1. Lefrancois G, et al. Anti-erythrocyte autoimmunisation during chronic falciparum malaria. Lancet. 1981;2:661–664. doi: 10.1016/S0140-6736(81)90998-3. - DOI - PubMed
    1. Rivera-Correa, J. R. A. in Malaria: Immune Response to Infection and Vaccination (eds Rodriguez, A. & Mota, M.) (Springer, Switzerland, 2016).

Publication types

MeSH terms