. 2017 Nov 3;8(1):1292.
doi: 10.1038/s41467-017-01300-1.

Autoinhibitory sterol sulfates mediate programmed cell death in a bloom-forming marine diatom

Affiliations

Autoinhibitory sterol sulfates mediate programmed cell death in a bloom-forming marine diatom

Carmela Gallo et al. Nat Commun. .

Abstract

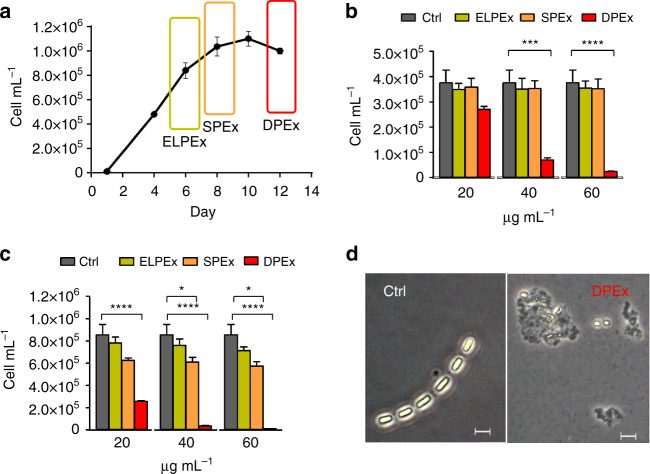
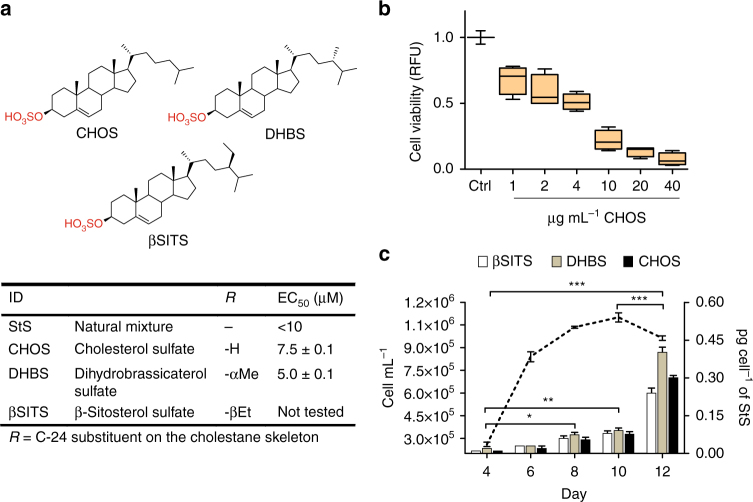
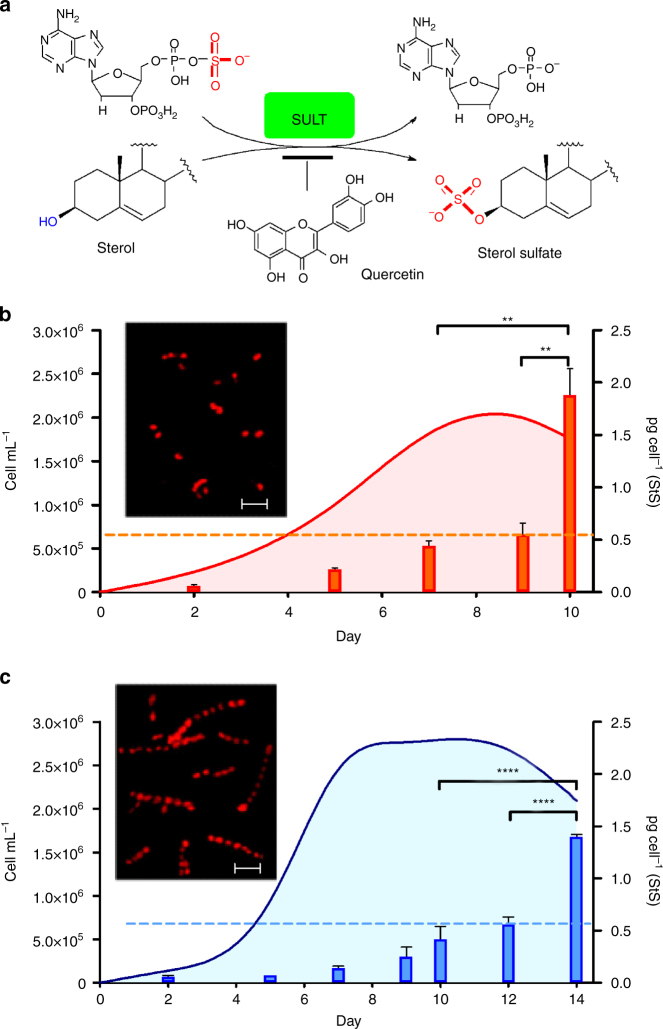
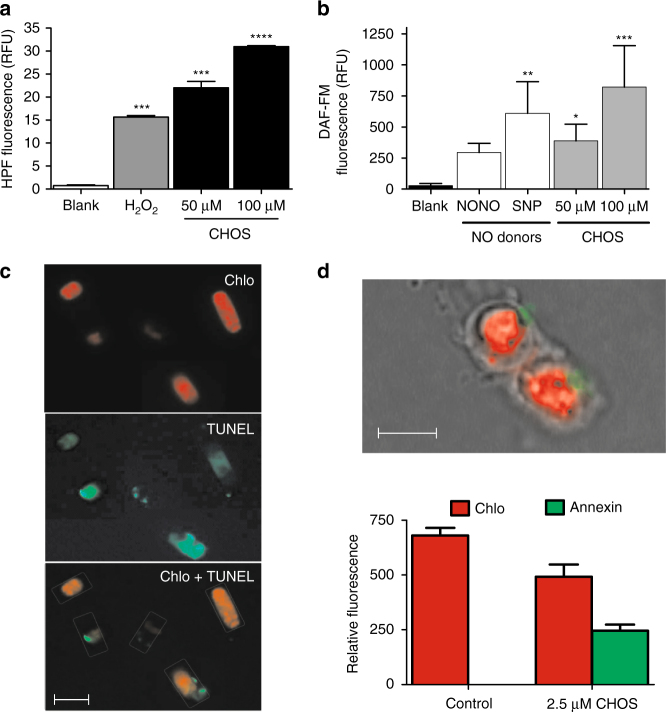
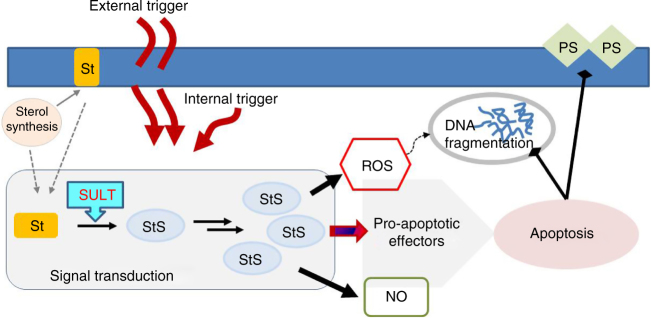
Cell mortality is a key mechanism that shapes phytoplankton blooms and species dynamics in aquatic environments. Here we show that sterol sulfates (StS) are regulatory molecules of a cell death program in Skeletonema marinoi, a marine diatom-blooming species in temperate coastal waters. The molecules trigger an oxidative burst and production of nitric oxide in a dose-dependent manner. The intracellular level of StS increases with cell ageing and ultimately leads to a mechanism of apoptosis-like death. Disrupting StS biosynthesis by inhibition of the sulfonation step significantly delays the onset of this fatal process and maintains steady growth in algal cells for several days. The autoinhibitory activity of StS demonstrates the functional significance of small metabolites in diatoms. The StS pathway provides another view on cell regulation during bloom dynamics in marine habitats and opens new opportunities for the biochemical control of mass-cultivation of microalgae.


Conflict of interest statement

The authors declare no competing financial interests.

Figures

Fig. 1
Fig. 1
Autoinhibitory activity of S. marinoi extracts on diatom growth. a Growth curve of S. marinoi. The rectangular sections indicate the time when cells were harvested and extracted. b, c Response of healthy S. marinoi cells (3 × 105 cells) after 24 h (b) and 48 h (c) exposure to growth phase-derived extracts in MeOH (20, 40, and 60 µg mL−1). Activity is expressed as cell concentrations (cell mL−1) compared to samples treated only with vehicle (Ctrl). Data are means ± s.d. of triplicates of four independent experiments. ELPEx = end of the log phase extract; SPEx = stationary phase extract; DPEx = declining phase extract; Ctrl = control (MeOH); *P < 0.01; ***P < 0.001; ****P < 0.0001 (two-way ANOVA); d Formation of cell aggregates in S. marinoi cultures after 48 h exposure to 20 µg mL−1 of extracts from cells harvested in the declining growth phase (DPEx). Ctrl = untreated cells. Images were taken at ×400 magnification. Scale bars depict 5 μm.
Fig. 2
Fig. 2
Structure and inhibitory activity of pure sterol sulfates from S. marinoi. a The diatom S. marinoi contains three main sterol sulfates with structures corresponding to cholesterol sulfate (CHOS), dihydrobrassicasterol sulfate (DHBS), and β-sitosterol sulfate (βSITS). Natural mixtures of these compounds and the purified products from S: marinoi extracts were tested (n = 3) at concentrations ranging from 0.5 to 60 μg mL−1 on healthy S. marinoi cells in log phase in 24-well plates for 48 h. EC50 was calculated by linear regression analysis of the logarithm of product concentration vs. mortality rate using standard curve analysis based on a four-parameter logistic in SigmaPlot 11 software. Data are means ± s.d. of triplicates of two independent experiments. b Average growth inhibition induced by a synthetic standard of CHOS μg per mL on S. marinoi cells at three different cell densities: 1 × 106, 6 × 105, and 3 × 105 cell per mL. Viability at 48 h was determined by the fluorescein diacetate (FDA) assay. Data (means ± s.d.) of Ctrl (DMSO) and CHOS (1, 2, 4, 10, 20, and 40 μg mL−1) are expressed as relative fluorescence units (RFU) (n = 3). c Growth curve and temporal pattern of StS levels (pg per cell) in S. marinoi cells. StS were quantified by LCMS, using Cholesterol-25,26,26,26,27,27,27-D7 Sulfate as internal standard. Data are means ± s.d. of triplicates of two independent experiments; *P < 0.05; **P < 0.01, ***P < 0.001 (two-way ANOVA)
Fig. 3
Fig. 3
Phylogenetic relationship of SULT proteins of diatoms. Phylogenetic analysis of SULTs alignment was inferred by using the Maximum Likelihood method based on the Poisson correction model. The tree with the highest log likelihood (−8017.2374) is shown. The bootstrap consensus tree inferred from 1000 replicates is taken to represent the evolutionary history of the taxa analyzed. Branches corresponding to partitions reproduced in <60% bootstrap replicates are collapsed. The percentage of replicate trees in which the associated taxa clustered together in the bootstrap test is shown next to the branches. Scale bars represent 0.05 substitutions per amino acid position. The four SULT putative sequences (S. marinoi CCMP2092-1, 2, 3, 4) were retrieved from the de novo transcriptome assembly of S. marinoi (CCMP2092) (Supplementary Table 2). Different colors represent different taxa: blue for cyanobacteria, brown for diatoms, red for human, light green for microalgae, and dark green for plants (Supplementary Table 4)
Fig. 4
Fig. 4
Reduction of cellular levels of StS improves growth and duration of S. marinoi cultures. a Biosynthesis of sterol sulfates by sulfotransferase (SULT) and 3′-phosphoadenosyl-5′-phosphosulfate (PAPS) as donor of the sulfonic group. Inhibition of this reaction by quercetin induces reduction of cellular levels of sterol sulfates. b, c Response of S. marinoi to the SULT inhibitor quercetin. The graphics show cell growth (cell mL−1) and cellular concentration (pg per cell) of sterol sulfates in diatom cultures maintained under standard conditions (red) and after addition of 20 μg mL−1 quercetin (blue). Cells were counted daily by Burker chamber and chlorophyll a fluorescence was measured. Data are means ± s.d. of quintuplicates of three independent experiments; **P < 0.01, ****P < 0.0001 (Tukey’s Multiple Comparison test). Inserts show fluorescence micrographs of control and treated cells in stationary phase (day 9) at ×200 magnification captured by an LP615 emission filter for red chlorophyll autofluorescence. Scale bar depicts 20 µm
Fig. 5
Fig. 5
Sterol sulfates trigger oxidative burst and programmed cell death (PCD) mechanisms in S. marinoi. a Production of hROS by exposure of diatom healthy cells to lethal concentrations (50 and 100 μM) of CHOS for 2 h. Activity was determined by the hydroxyphenyl fluorescein (HPF) assay. Data (n = 6) are reported as relative fluorescence units (RFU) ± s.d. H2O2 (200 µM) was used as positive control. Blank = untreated cells; ***P < 0.001, ****P < 0.0001 (one-way ANOVA of treated cells vs blank); b Production of nitric oxide (NO) by exposure of diatom healthy cells to lethal concentrations (50 and 100 μM) of CHOS for 4 h. Activity was determined by 4-amino-5-methylamino-2′,7′-difluorescein diacetate (DAF-FM). Data (n = 6) are reported as relative fluorescence units (RFU) ± s.d. The NO donors diethylamine nitric oxide (NONOate) and sodium nitroprusside (SNP) were used as positive control. Blank = untreated cells; *P < 0.05, **P < 0.01, ***P < 0.001 (one-way ANOVA of treated cells vs. blank); c DNA fragmentation assessed by TUNEL assay after 24 h application of 2.5 µM CHOS. View under the fluorescence microscope by using 515/565 band filter for the green fluorescence and a LP615 band filters for only red fluorescence emission. Chlorophyll autofluorescence is represented in red (above), fluorescein (TUNEL) in green (middle), merged green and red signal (below). d Phosphatidylserine externalization assessed by Annexin V after 24 h application of 2.5 µM CHOS. Composed picture of S. marinoi cells under the fluorescence microscope at ×1000 magnification by oil-immersion lens and quantification of the red fluorescence due to chlorophyll and the green fluorescence due to FITC bound to Annexin V. GFP Images were analyzed by ImageJ and normalized to gray value. Data (n = 9) are reported as relative fluorescence units (RFU) ± s.d. Control = untreated cells; Scale bars depict 10 µm
Fig. 6
Fig. 6
Signaling transduction by sterol sulfates in S. marinoi. The accumulation of sterol sulfates (StS) has a central role in regulating the diatom cell fate and the associated biochemical responses. Increase of their intracellular levels above a threshold of 0.5–0.6 pg per cell alters redox balance and induces rapid generation of NO. The ultimate effect is the launch of apoptotic events that lead to cell death. The effectors of this last process have not been identified yet but metacaspases are reported in S. marinoi and other diatoms. Synthesis of StS requires sulfonation of the sterol substrates, thus control of the pathway may concern de novo synthesis of sterols, mobilization of sterols from the membrane bilayer or up-regulation of SULT expression. Each of these processes can be triggered by environmental or physiological factors that, depending on the degree and type, determine the intracellular level of StS and, eventually, cell fate. A variety of environmental stressors or chemical molecules, including sterols, can activate SULT expression via specific nuclear receptors according to the literature on SULTs in other organisms

References

    1. Armbrust EV. The life of diatoms in the world’s oceans. Nature. 2009;459:185–192. doi: 10.1038/nature08057. - DOI - PubMed
    1. Falkowski PG, Barber RT, Smetacek V. Biogeochemical controls and feedbacks on ocean primary production. Science. 1998;281:200–206. doi: 10.1126/science.281.5374.200. - DOI - PubMed
    1. Allen JT, et al. Diatom carbon export enhanced by silicate upwelling in the northeast Atlantic. Nature. 2005;437:728–732. doi: 10.1038/nature03948. - DOI - PubMed
    1. Bidle KD, Falkowski PG. Cell death in planktonic, photosynthetic microorganisms. Nat. Rev. Microbiol. 2004;2:643–655. doi: 10.1038/nrmicro956. - DOI - PubMed
    1. Bidle KD. Programmed cell death in unicellular phytoplankton. Curr. Biol. 2016;26:R594–R607. doi: 10.1016/j.cub.2016.05.056. - DOI - PubMed

Publication types

MeSH terms

LinkOut - more resources