. 2017 Nov 3;7(1):14472.
doi: 10.1038/s41598-017-15196-w.

Gut dysbiosis and impairment of immune system homeostasis in perinatally-exposed mice to Bisphenol A precede obese phenotype development

Affiliations

Gut dysbiosis and impairment of immune system homeostasis in perinatally-exposed mice to Bisphenol A precede obese phenotype development

Yann Malaisé et al. Sci Rep. .

Abstract

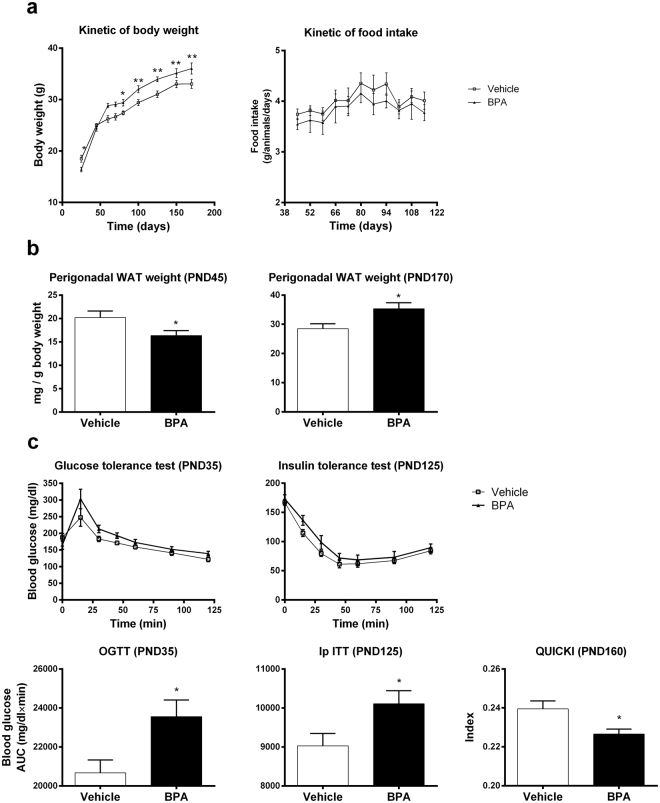
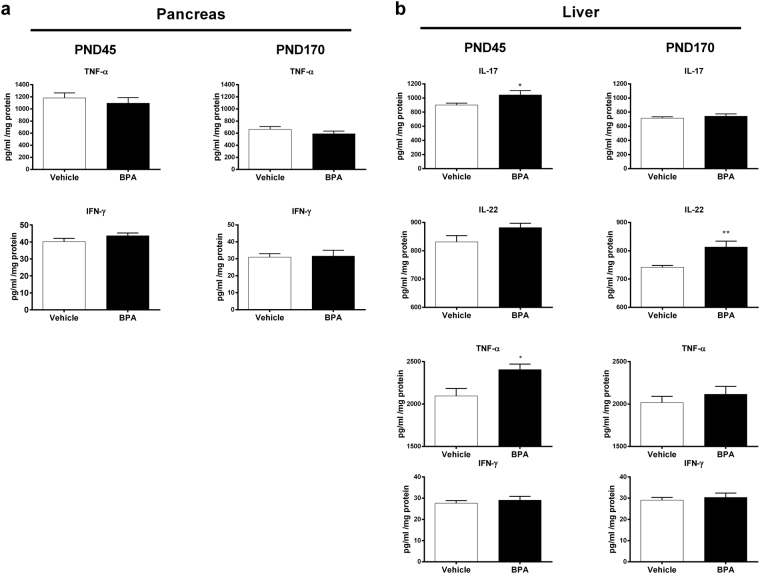
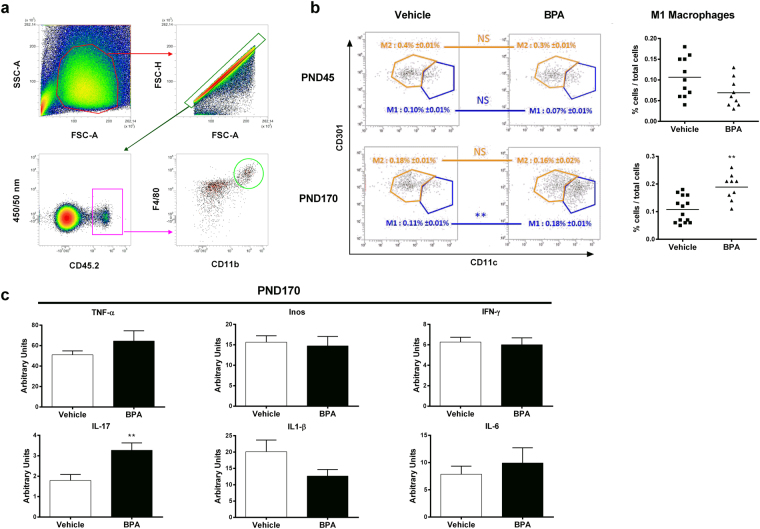
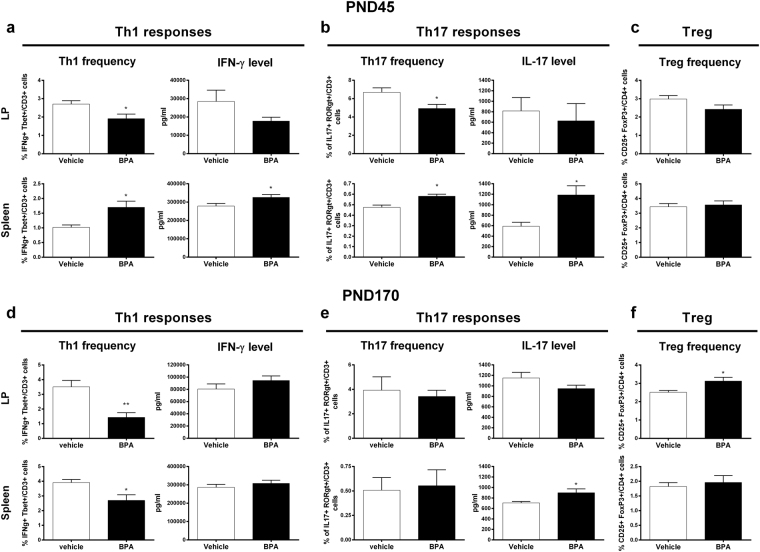
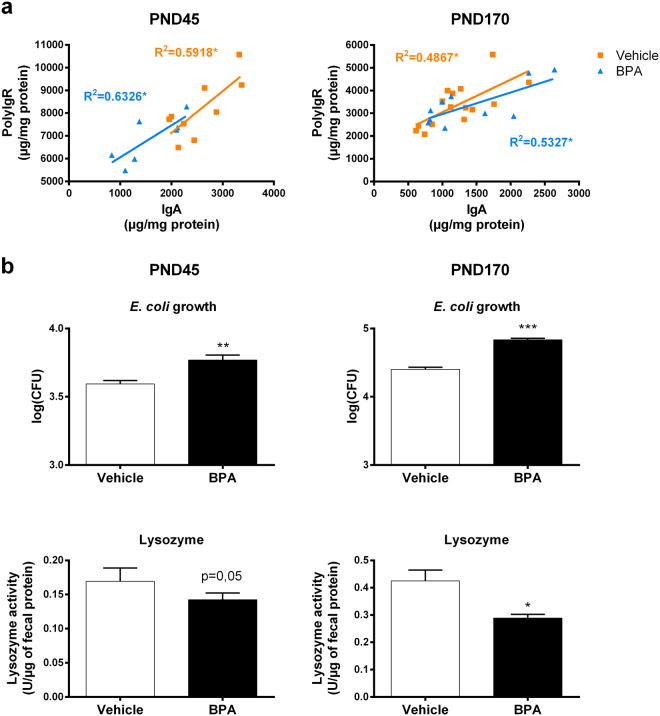
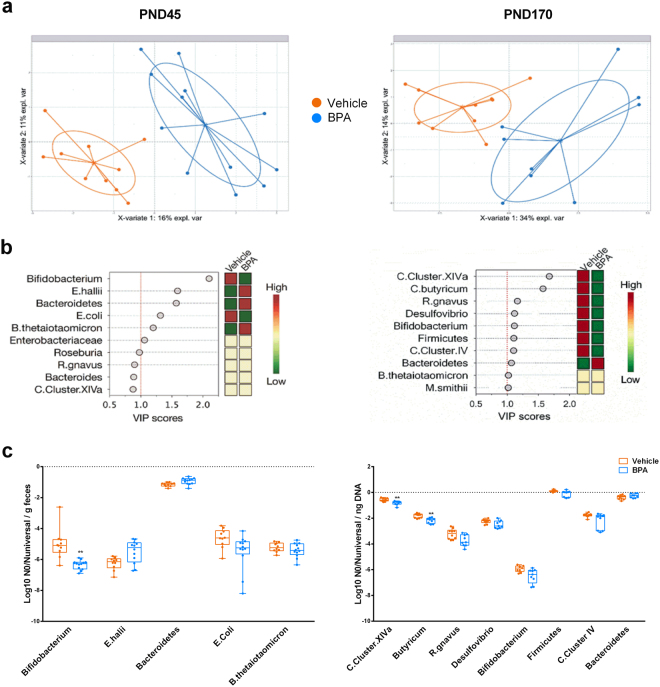
Epidemiology evidenced the Bisphenol A (BPA), a chemical found in daily consumer products, as an environmental contributor to obesity and type II diabetes (T2D) in Humans. However, the BPA-mediated effects supporting these metabolic disorders are still unknown. Knowing that obesity and T2D are associated with low-grade inflammation and gut dysbiosis, we performed a longitudinal study in mice to determine the sequential adverse effects of BPA on immune system and intestinal microbiota that could contribute to the development of metabolic disorders. We observed that perinatal exposure to BPA (50 µg/kg body weight/day) induced intestinal and systemic immune imbalances at PND45, through a decrease of Th1/Th17 cell frequencies in the lamina propria concomitant to an increase of splenic Th1/Th17 immune responses. These early effects are associated with an altered glucose sensitivity, a defect of IgA secretion into faeces and a fall of faecal bifidobacteria relative to control mice. Such BPA-mediated events precede infiltration of pro-inflammatory M1 macrophages in gonadal white adipose tissue appearing with ageing, together with a decreased insulin sensitivity and an increased weight gain. Our findings provide a better understanding of the sequential events provoked by perinatal exposure to BPA that could support metabolic disorder development in later life.


Conflict of interest statement

The authors declare that they have no competing interests.

Figures

Figure 1
Figure 1
Perinatal exposure to BPA provokes metabolic disorders in offspring male mice. (a) Body weight of BPA and vehicle mice was measured from PND21 to PND170. (b) Perigonadal WAT weight of BPA and vehicle offspring was determined at PND45 and PND170. (c) Glucose and insulin tolerance tests were performed at PND35 and 125 respectively. The Quantitative Insulin Sensitivity Check Index (QUICKI) was calculated at PND160. Data represent the mean ± s.e.m. (n = 10–16). Data were representative from two batches of experiments. *P < 0.05, **P < 0.01, vs. non-exposed group using a Mann-Whitney’s post-hoc analysis.
Figure 2
Figure 2
The metabolic disorders due to BPA is associated with liver but not with pancreas inflammation. At PND45 and PND170, cytokine levels were determined in pancreas (TNF-α and IFN-γ) (a) and in liver (IL-17, IL-22, TNF-α and IFN-γ) (b) of BPA and vehicle exposed offspring. Data represent the mean ± s.e.m. (n = 10–16). Data were representative from two batches of experiments. *P < 0.05, **P < 0.01, vs. non-exposed group using a Mann-Whitney’s post-hoc analysis.
Figure 3
Figure 3
Perinatal exposure to BPA induces inflammated-M1 deviation in gonadal WAT associated with IL-17 inflammation. (a) Gating strategies for perigonadal WAT macrophages (b) M1 and M2 macrophages were phenotypically characterized from CD45.2+ F4/80+ CD11b+ cells in perigonadal WAT of BPA and vehicle-exposed offspring at PND45 and PND170. (c) TNF-α, Inos, IFN-γ, IL-17, IL1-β and IL-8 expression levels were determined in perigonadal WAT by RT-PCR at PND170. Data represent the mean ± s.e.m. (n = 10–16). Data were representative from two batches of experiments. **P < 0.01, vs. non-exposed group using a Mann-Whitney’s post-hoc analysis.
Figure 4
Figure 4
Perinatal BPA exposure disturbs the immune homeostasis in LP and spleen. Proportion of CD3+ Tbet+ IFN-γ+ Th1 cells, CD3+ RORγt+ IL-17+ Th17 cells and CD4+ CD25+ FoxP3+ Treg cells in LP and spleen of BPA and vehicle exposed offspring at PND45 (ac) and PND170 (df). IFN-γ and IL-17 levels measured at PND45 and PND170 in supernatant of isolated LP cells and splenocytes after 3 days of in vitro anti-CD3/CD28 stimulation. Data represent the mean ± s.e.m. (n = 8–16). Data were representative from two batches of experiments. *P < 0.05, **P < 0.01, vs. non-exposed group using a Mann-Whitney’s post-hoc analysis.
Figure 5
Figure 5
Perinatal exposure to BPA impairs local IgA production and antimicrobial activity leading to dysbiosis in faeces. (a) Faecal IgA and polyIgR levels were assessed and a linear regression has been made to correlate these two parameters in BPA and vehicle exposed offspring at PND45 and PND170. (b) Impact of 1 mg of faecal supernatant protein on commensal E. coli growth and lysozyme activity in faecal supernatant from BPA and vehicle exposed offspring at PND45 and PND170. Data represent the mean ± s.e.m. (n = 8–16). Data were representative from two batches of experiments. *P < 0.05, **P < 0.01, ***P < 0.001 vs. non-exposed group using a Mann-Whitney’s post-hoc analysis.
Figure 6
Figure 6
Faecal microbial alterations in response to perinatal exposure of BPA in mice offspring at PND45 and PND170. (a) PLS-DA score plots of the relative quantitative abundances (Log10 No) of twenty-two microbial taxa in faeces of BPA and vehicle offspring. (b) VIP plot representing the ten most discriminating features (microbial taxa) identified by PLS-DA build models at PND45 and PND170 (n = 9–10). (c) Relative abundances per ng DNA of microbial taxa with a VIP > 1 by real-time PCR. **P < 0.01, vs. non-exposed group using a Mann-Whitney’s post-hoc analysis and adjustment using Benjamini-Hochberg’s method.

References

    1. WHO’s media centre, Obesity and overweight. WHO’s fact sheet 2016. http://www.who.int/mediacentre/factsheets/fs311/en/ (2016).
    1. Darbre, P. D. Endocrine Disruptors andObesity. Curr. Obes. Rep., 10.1007/s13679-017-0240-4 (2017). - PMC - PubMed
    1. Newbold RR. Impact of environmental endocrine disrupting chemicals on the development of obesity. Horm. Athens Greece. 2010;9:206–217. doi: 10.14310/horm.2002.1271. - DOI - PubMed
    1. Bagchi, D. & Preuss, H. G. Obesity epidemiology, pathophysiology, and prevention. (CRC Press, 2013).
    1. Trasande L, Attina TM, Blustein J. Association Between Urinary Bisphenol A Concentration and Obesity Prevalence in Children and Adolescents. JAMA. 2012;308:1113. doi: 10.1001/2012.jama.11461. - DOI - PubMed

Publication types

MeSH terms