. 2018 Apr:14:499-508.
doi: 10.1016/j.redox.2017.10.020. Epub 2017 Oct 26.

Lipidomics reveals accumulation of the oxidized cholesterol in erythrocytes of heart failure patients

Affiliations

Lipidomics reveals accumulation of the oxidized cholesterol in erythrocytes of heart failure patients

Hsiang-Yu Tang et al. Redox Biol. 2018 Apr.

Abstract

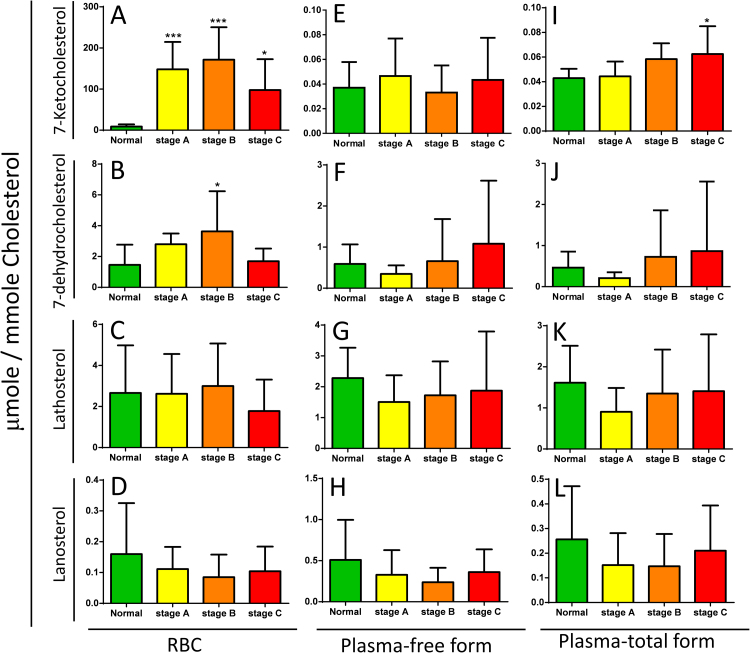
Lipids play an important role in the pathogenesis of cardiovascular disease. Changes in lipids of erythrocytes are indicative of the outcome of pathophysiological processes. In the present study, we assessed whether the lipid profiles of erythrocytes from heart failure (HF) patients are informative of their disease risk. The lipidomes of erythrocytes from 10 control subjects and 29 patients at different HF stages were analyzed using liquid chromatography time-of-flight mass spectrometry. The lipid composition of erythrocytes obtained from HF patients was significantly different from that of normal controls. The levels of phosphatidylcholines (PCs), phosphatidylethanolamines (PEs), and sphingomyelins decreased in HF erythrocytes as compared with those of control subjects; however, the levels of lysoPCs, lysoPEs, and ceramides increased in HF erythrocytes. Notably, the oxidized cholesterol 7-ketocholesterol (7KCh) accumulated to higher level in HF erythrocytes than in plasma from the same patients. We further validated our findings with a cohort of 115 subjects of control subjects (n=28) and patients (n=87). Mechanistically, 7KCh promoted reactive oxygen species (ROS) formation in cardiomyocytes; and induced their death, probably through an ATF4-dependent pathway. Our findings suggest that erythrocytic 7KCh can be a risk factor for HF, and is probably implicated in its pathophysiology.

Keywords: 7-ketocholesterol; Heart failure; Lipidomics; Oxidative stress.


Figures

Fig. 1
Fig. 1
Liquid chromatography time-of-flight mass spectrometry-based lipidomics analysis of heart failure (HF) erythrocytes. Erythrocytes from normal control subjects and patients with stages A, B, and C were isolated for time-of-flight mass spectrometry analysis in electrospray ionization (ESI) positive and negative modes. Basal peak chromatograms of patients with HF at different stages and normal control subjects were obtained in ESI positive (A) and negative (B) modes, respectively. The molecular features were identified in samples (n = 39) by using Progenesis QI software and further data processing and statistical analysis were performed through SIMCA-P. Orthogonal partial least squares discriminant analysis (OPLS-DA) was performed for all samples, and the score plots for data sets obtained in ESI positive (C) and negative modes (E) are shown. The data for normal control and patients with stage C were reanalyzed using OPLS-DA, and the score plots for data sets obtained in ESI positive (D) and negative modes (F) are shown. Metabolites with significant differences in abundance in ESI positive and negative modes between normal control and patients with stage C are presented in S-plots (G and I), respectively. The Venn diagrams of the features obtained in ESI positive (VIP > 1.0 and p < 0.01) and ESI negative (VIP > 1.0 and p < 0.01) modes are shown in panels H and J, respectively. The normal control (n = 10), stage A (n = 10), stage B (n = 9), and stage C (n = 10) groups are marked in green, yellow, orange, and red, respectively. The ellipse shown in the model represents the Hotelling T2 with 95% confidence.
Fig. 2
Fig. 2
Quantification of the free forms of 7KCh and other sterols in plasma and erythrocytes from patients with HF and controls. Erythrocyte samples were extracted for free-form sterols, and the levels of cholesterol, lanosterol, lathosterol, 7-dehydrocholesterol, and 7KCh (7-ketocholesterol) were quantified using a LC-MS-MS. The levels of 7KCh, lanosterol, lathosterol, and 7-dehydrocholesterol were normalized to the level of cholesterol (per mmole). All samples from the normal control subjects (NC, n = 28) and patients with HF in stages A (n = 29), B (n = 29), and C (n = 29) are represented in panels B, C, D, and E, respectively. The free-form sterols in the corresponding plasma samples were determined, and the levels were also normalized to the level of cholesterol (per mmole) and are shown in panels F, G, H, and I. A schematic showing the cholesterol biosynthesis pathway (A). Data are expressed as 7KCh/Cholesterol (μmole/mmole). Data are means ± SD; *p < 0.05, **p < 0.01, ***p < 0.001 for patients with stages A, B, or C vs. controls.
Fig. 3
Fig. 3
Quantification of the total forms of 7KCh and other sterols in plasma from HF patients. For total cholesterol (free cholesterol plus cholesteryl ester) quantification, plasma samples were pre-treated with cholesteryl ester hydroxylase as described in Materials and methods section. The sterols were extracted, and the levels of cholesterol, lanosterol, lathosterol, 7-dehydrocholesterol and 7KCh (7-ketocholesterol) in sample were quantified by LC-TQ mass spectrometer. The levels of 7KCh, lanosterol, lathosterol, 7-dehydrocholesterol in samples from normal control subjects (NC, n=10) and patients with HF in stage A (n=10), stage B (n=9), and stage C (n=10) were represented in panel I, J, K, and L, respectively. The free form of sterols in the corresponding plasma samples were determined, and the levels were shown in panel E, F, G, and H. For comparison, the free form of sterols in the corresponding erythrocyte samples were shown in panel A, B, C, and D. Data are expressed as 7KCh/Cholesterol (μmole/mmole). Data are means ± SD; *p<0.05, ***p<0.001, group of stage A, B, or C patients vs. control group.
Fig. 4
Fig. 4
Viability reduction and ROS generation in 7KCh accrued HL-1 cells. HL-1 cells (5 × 10⁴/well) were treated with the indicated concentrations (0, 10, 20, 50 μM) of 7KCh and cholesterol (Chol) for 24 h (A) and 48 h (B), respectively. In addition, cells were treated with different concentrations (0, 10, 20, 50, 75, 100, 150, 200 μM) of 7KCh- or cholesterol-loaded erythrocyte ghost for 24 h (C) and 48 h (D), respectively. The viabilities of the treated cells were determined, and are expressed as percentage of that of untreated HL-1 cells. Data are means ± SD, n = 3; *p < 0.05, **p < 0.01, ***p < 0.001 for 7KCh-treated cells vs. untreated cells. (E) Immunostaining for 7KCh in HL-1 cells. HL-1 cells were untreated (control) or treated 20 μM 7KCh, and stained with primary antibody to 7KCh and secondary antibody conjugated to Alexa-488 (green). Hoechst 33342 (blue) was used to stain cellular nuclei. A representative experiment out of three is shown. (F) 7KCh induces ROS generation. HL-1 cells were treated with 10, 20 μM 7KCh or cholesterol (Chol) for 24 h, stained with H2DCFDA (green) and MitoSOX red (red), and analyzed using flow cytometry. H2O2-treated cells were positive control. The MFI was determined, and is expressed as fold change relative to that of untreated HL-1 cells. Data are means ± SD, n = 3; *p < 0.05 for 7KCh-treated cells vs. untreated cells.
Fig. 5
Fig. 5
7KCh activates transcription factor 4 (ATF4) pathway. (A) A schematic diagram showing the proposed effect of 7KCh on ATF4/CHOP pathway. (B) HL-1 cells were treated with 10 μM 7KCh for the indicated periods (0, 12, 24, 36, 48 h), and the cell lysate was analyzed for the levels of ATF4, CHOP, and caspase 3, LC3 and actin (loading control) by immunoblotting with respective antibodies. A representative experiment out of three is shown. The relative intensities of ATF4 (C), CHOP (D), cleaved Caspase-3 (E), caspase-3 (F), and LC3A/B (G) were normalized to that of actin, and are expressed as fold change relative to those of untreated HL-1 cells. Data are mean ± SD, n=3. *p<0.05, **p<0.01, ***p<0.001 vs. untreated cells.
Fig. 6
Fig. 6
A proposed model of the effect of erythrocyte 7KCh on cardiomyocytes. Erythrocytes may transport 7KCh to cardiac tissue, and inflicts damage to cardiac cells.

References

    1. Bahrami H., Bluemke D.A., Kronmal R. Novel metabolic risk factors for incident heart failure and their relationship with obesity: the MESA (Multi-Ethnic Study of Atherosclerosis) study. J. Am. Coll. Cardiol. 2008;51:1775–1783. - PubMed
    1. Ingelsson E., Arnlov J., Sundstrom J., Zethelius B., Vessby B., Lind L. Novel metabolic risk factors for heart failure. J. Am. Coll. Cardiol. 2005;46:2054–2060. - PubMed
    1. Turer A.T. Using metabolomics to assess myocardial metabolism and energetics in heart failure. J. Mol. Cell Cardiol. 2012 - PubMed
    1. Ingwall J.S. Energetics of the failing heart: new insights using genetic modification in the mouse. Arch. Mal. Coeur Vaiss. 2006;99:839–847. - PubMed
    1. Ashrafian H., Redwood C., Blair E., Watkins H. Hypertrophic cardiomyopathy: a paradigm for myocardial energy depletion. Trends Genet. 2003;19:263–268. - PubMed

Publication types