. 2017 Dec 6;96(5):1127-1138.e4.
doi: 10.1016/j.neuron.2017.10.017. Epub 2017 Nov 2.

Local Order within Global Disorder: Synaptic Architecture of Visual Space

Affiliations

Local Order within Global Disorder: Synaptic Architecture of Visual Space

Benjamin Scholl et al. Neuron. .

Abstract

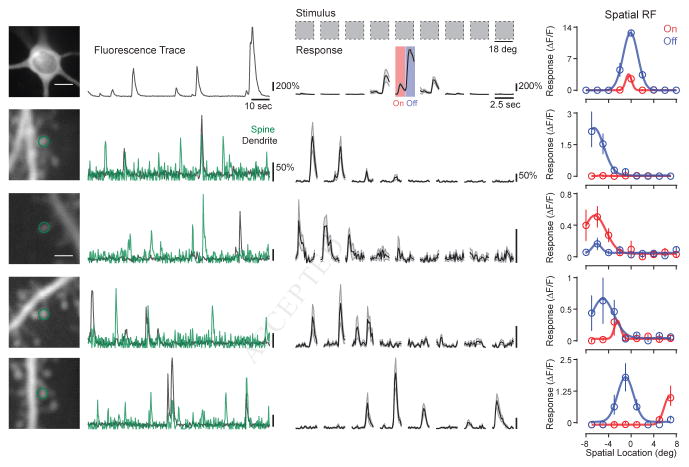
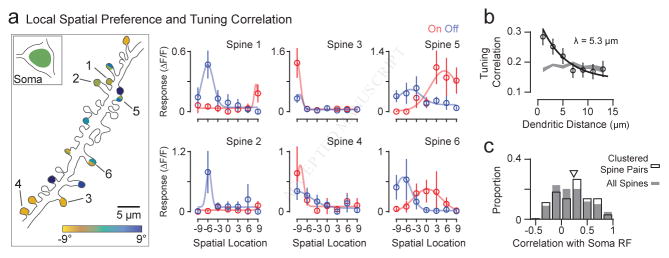
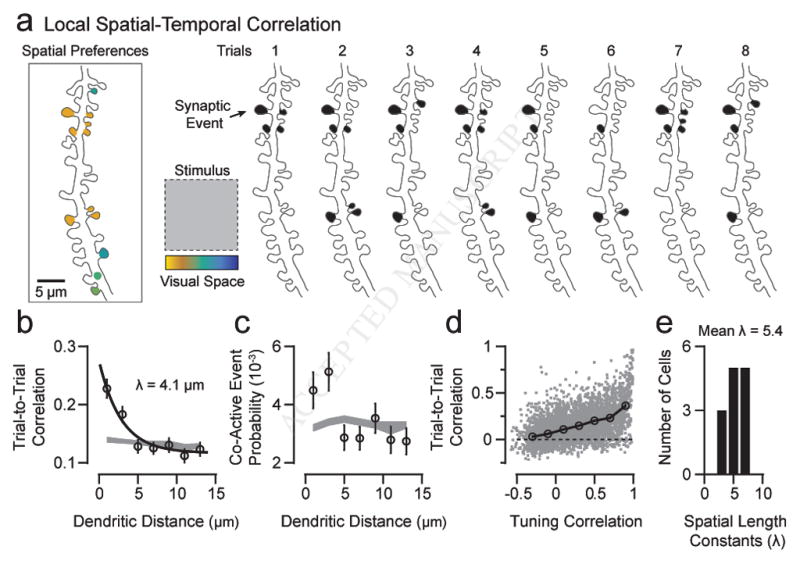
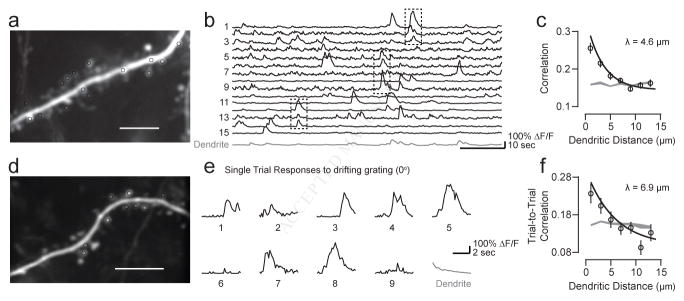
Substantial evidence at the subcellular level indicates that the spatial arrangement of synaptic inputs onto dendrites could play a significant role in cortical computations, but how synapses of functionally defined cortical networks are arranged within the dendrites of individual neurons remains unclear. Here we assessed one-dimensional spatial receptive fields of individual dendritic spines within individual layer 2/3 neuron dendrites. Spatial receptive field properties of dendritic spines were strikingly diverse, with no evidence of large-scale topographic organization. At a fine scale, organization was evident: neighboring spines separated by less than 10 μm shared similar spatial receptive field properties and exhibited a distance-dependent correlation in sensory-driven and spontaneous activity patterns. Fine-scale dendritic organization was supported by the fact that functional groups of spines defined by dimensionality reduction of receptive field properties exhibited non-random dendritic clustering. Our results demonstrate that functional synaptic clustering is a robust feature existing at a local spatial scale. VIDEO ABSTRACT.

Keywords: dendritic spine; synaptic cluster; visual cortex.


Figures

Figure 1
Figure 1. Measuring 1-D spatial receptive fields of individual soma and spines
(a) Two-photon projection of a cortical cell soma and an example ΔF/F fluorescence trace during visual stimulation are shown (left). Stimulus-averaged responses for each bar location in visual space revealed spatial and polarity selectivity (right). Stimulus onset is at the beginning of each response shown. Black lines and gray shading indicate mean and SE, respectively. Temporal specificity of responses to individual bars allows separation of ON (e.g. increase in luminance) or OFF (e.g., decrease in luminance) responses, shown as red and blue, respectively. Peak ΔF/F responses extracted from stimulus-triggered cycles were used to generate ON and OFF spatial RFs (right). Data were fit to a Gaussian curve. (b) Same as (a) for an individual spine. Spine residual ΔF/F fluorescence trace (green) shows large, independent, isolated calcium events. (c–e) Same as (b) for additional spines from the same cortical cell. See also Figures S1–3.
Figure 2
Figure 2. Lack of global dendritic organization for spine spatial preferences
(a–b) Two example single neurons with all serially imaged visually responsive spines and corresponding soma colored by spatial preference (scale bar 50 μm). Spatial preferences are shown for dominant polarity for each spine. (c) Distribution of normalized spine responses for a single bar location is shown with a dendritic center of mass (gray ellipse). Ellipse axes are two SDs of spatial patterns of synaptic responses. Inset: center of mass ellipses for each stimulus spatial location. (d) An example is shown of the overlap of the center of mass ellipses calculated for two different spatial locations. (e) The relationship between bar position distance and center of mass overlap is shown. (f) The relationship between bar position distance relative to the soma preference and center of mass overlap is shown. (g) The relationship between bar position distance and center of mass overlap for ON (red) and OFF (blue) spatial patterns is shown separately. (h) The distribution of spine ON spatial preferences, relative to the soma, is shown at distal (>75 μm) and proximal (<75 μm) dendritic locations. (i) Same as (h) for OFF spatial preferences. (j) Distribution of spine ON-OFF ratios at distal and proximal dendritic locations is shown. See also Figure S3.
Figure 3
Figure 3. Local clustering of spine spatial RF properties
(a) Example dendritic branch is shown with spines sharing similar spatial preference and RF properties. Spines are colored based on spatial preference for ON and OFF. Spines with multiple colors indicate strong ON and OFF responses with different spatial preference. Spatial ON and OFF ΔF/F responses (mean and SE) are shown with a fitted Gaussian curve. (b) Tuning correlation between spines is dependent on dendritic distance. Data shown are mean and SE with an exponential curve fit (black line). A bootstrapped shuffled correlation is also shown (gray). (c) The distribution is shown of the mean correlation of clustered spine pairs (correlation > 0.5, distance < 10 μm) with soma RF (black outline). Also shown is the distribution of RF correlation between all individual spines and soma (gray). See also Figure S4.
Figure 4
Figure 4. Synaptic clusters exhibit spatiotemporal correlation
(a) Example dendritic branch is shown with responsive dendritic spines, colored by spatial preference. Co-active synaptic events occurred across repeated presentations of a bar at a single spatial location. (b) The trial-to-trial correlation between spines was dependent on dendritic distance. Data shown are mean and SE with an exponential curve fit (black line). A bootstrapped shuffled correlation is also shown (gray). See also Figure S5. (c) The probability of co-active synaptic events is plotted relative to spine dendritic distance. Data shown are mean and SE, and a bootstrapped shuffled correlation is shown in gray. (d) The relationship between spine tuning correlation and trial-to-trial correlation is shown. Individual points (gray squares) are shown with mean and SE (black circles). (e) The distribution of spatial length constants were measured across cells.
Figure 5
Figure 5. Local clustering of spontaneous activity and drifting grating evoked co-activity
(a) Two-photon projection of an example dendritic branch with dendritic spines is shown. (b) Time-series traces of ΔF/F activity from a subset of dendritic spines (black) and corresponding global dendritic activity (gray) are shown. Note that spine time-series traces are bAP-subtracted and an exponential filter has been applied (see Methods). (c) The relationship between spine correlation of spontaneous activity and distance along dendritic shaft is shown. Data are shown as mean and SE with an exponential curve fit (black line). A bootstrapped shuffled correlation is shown in gray. (d) Two-photon projection of an example dendritic segment is shown. (e) Individual dendritic spine responses (black) to the presentation of a single oriented grating (0°) is shown, as well as the corresponding dendritic response (gray). (f) The trial-to-trial correlation between spines during drifting grating presentation is dependent on dendritic distance. Data are shown as mean and SE with an exponential curve fit (black line). A bootstrapped shuffled correlation is shown in gray.
Figure 6
Figure 6. Synaptic clusters convey functionally distinct spatial RF properties
(a) A population of spines from an example cell and z-scored spatial RF responses for both polarities are shown. (b) Left: 2-D visualization of principal component coefficients is shown for the synaptic population in (a) [computed using t-SNE (Maaten and Hinton, 2008)]. Each point represents one spine. Middle: k-means cluster evaluation score is shown for these coefficients. Right: 2-D visualization of principal component coefficients for the synaptic population in (a) is shown. Colors indicate group labels from k-means clustering. (c) Dendritic locations of a subset of spines from (a) are shown. Each spine is colored to indicate the group label from k-means clustering; the group label from k-means clustering is also indicated next to each spine. (d) Neighboring spines < 5 μm distant are more likely to found in the same functional cluster compared to a bootstrapped shuffle (left). Neighboring spines within a 5–10 μm or 10–15 μm distance are no more likely to be from the same functional cluster than chance (middle, right). Shown are points from individual cells (white) and the population (black), in mean and SE. (e) Spatial RFs were generated by averaging spine spatial RFs within the same defined cluster. Data are shown as mean and SE for ON (red) and OFF (blue) responses, normalized within each functional cluster. Also shown is a soma RF (far right). (f) Shown is the relationship between the correlation of functional clusters and soma RFs and the proportion of spines in a corresponding functional cluster.

References

    1. Ascoli GA, Donohue DE, Halavi M. NeuroMorpho.Org: a central resource for neuronal morphologies. The Journal Neuroscience. 2007;27(35):9247–51. - PMC - PubMed
    1. Behabadi BF, Polsky A, Jadi M, Schiller J. Location-dependent excitatory synaptic interactions in pyramidal neuron dendrites. PLoS Comput Bio. 2012;8(7):e1002599. - PMC - PubMed
    1. Branco T, Clark BA, Häusser M. Dendritic discrimination of temporal input sequences in cortical neurons. Science. 2010;329:1671–1675. - PMC - PubMed
    1. Caliński T, Harabasz J. A dendrite method for cluster analysis. Communications in Statistics-theory and Methods. 1974;3(1):1–27.
    1. Chen T-W, Sun Y, Baohan A, Jayaraman V, Svoboda K. Ultrasensitive fluorescent proteins for imaging neuronal activity. Nature. 2013;499:295. - PMC - PubMed

LinkOut - more resources